Dimensional Management: Definition, Process, Tools, Standards, and Applications in Manufacturing
Dimensional management (DM) is an engineering discipline that controls accumulated geometric and dimensional variation across the product lifecycle. Dimensional management uses computer-simulation tools to help multi-component products assemble and function correctly. Dimensional management is preventive, unlike reactive tolerancing, which assigns feature limits and inspects parts after production.
DM improves quality, cuts cost, and delivers first-time-right assembly, shortening concept-to-market time. The DM process follows a lifecycle closed loop that includes design definition, variation simulation, part measurement, and process control. This loop runs in 5 steps, first defining datums and datum reference frames, second identifying key product and control characteristics, third running tolerance stack-up and variation simulation, fourth measuring and inspecting parts, and fifth validating through measurement feedback.
DM uses a handful of tool categories, including tolerance analysis software, metrology tools, and computer-aided design (CAD) together with Product Lifecycle Management (PLM) systems. DM meets 2 standards, including ASME Y14.5 in North America and the ISO Geometrical Product Specification (GPS) suite internationally. Both standards formalize geometric dimensioning and tolerancing (GD&T). GD&T is the language specifying allowable variation on drawings and model-based definition.
DM is critical in automotive, industry, and medical-device manufacturing, where fit and function depend on part-tolerance stack-up. Recurring DM challenges include stack-up accumulation, measurement-system error, process-capability gaps, and cross-functional communication gaps. DM operationalizes tolerance analysis and robust design before tooling commitment.
/
Trusted by engineering teams building high‑performance mechanical products



What is Dimensional Management
Dimensional management is the engineering discipline that controls accumulated dimensional variation across the lifecycle. Dimensional management pairs a methodology with computer-simulation tools that predict variation propagation through an assembly and support design decisions that accommodate allowable variation. This helps multi-component products assemble and function correctly the first time. Dimensional management defines and monitors the integrated product development cycle against dimensional quality goals. In manufacturing and mechanical engineering, dimensional management keeps each part, assembly, or vehicle as close to nominal as function permits. The applied practice of dimensional management is dimensional engineering. The 7 objectives of a dimensional management program and what each objective achieves are described below
Objective
What it achieves
Dimensional management applies to tape-measurable, multi-component products whose fit and function depend on many stacked part tolerances, wherever precision, assembly performance, and compliance are critical. Primary industries are automotive, aerospace, and medical devices. Dimensional management suits complex assemblies across OEMs and suppliers, in a computer-aided engineering (CAE) environment linked to CAD (Computer-aided design) and PLM (product lifecycle management).
How does dimensional management differ from traditional tolerancing practices?
Dimensional management differs from traditional tolerancing in scope, timing, and stance toward variation.
In some companies tolerancing is reactive, assigning acceptable upper and lower limits to individual drawing features just before release so parts stay interchangeable and fit as intended. Typically the results are strict tolerance requirements for the finished parts against those limits for per-part conformance.
Dimensional management is a lifecycle-wide, preventive discipline predicting how variation propagates through the whole assembly and closing a production-to-design feedback loop. Dimensional management controls total variation for first-time-right assembly while allocating it to reduce cost. Its objective is a design and process that absorbs as much variation as possible without affecting product function. Dimensional management "differs from the traditional design practice of assigning tolerances to drawings prior to release" according to ASM Handbook: Materials Selection and Design.
Why is Dimensional Management Important?
Dimensional management is important because part deviations from nominal geometry accumulate along an assembly's tolerance stack-up paths, so parts that pass inspection limits still fail to fit or function in the assembly. Dimensional management controls variation upstream. Three-dimensional tolerance analysis predicts how that variation propagates through the assembly. The production-to-design feedback loop turns an uncertain assembly result into a predictable, capable result that assembles correctly the first time.
The 6 benefits of dimensional management are described below.
- Reduced scrap and rework: Reduced scrap and rework spare production and quality teams material and rework-labor waste when variation is simulated before production.
- Higher first-pass yield: Higher first-pass yield lets design and assembly teams fix tolerances at least cost by predicting hundreds of feature variations before tooling is cut, cutting downstream defects and non-conformance.
- Lower launch and late-change cost: Lower launch and late-change cost spares program and tooling teams the compounding scrap, engineering-change, and tooling-delay costs when variation is caught in early design.
- Reduced warranty exposure: Reduced warranty exposure lowers warranty claims and lost sales for quality and after-sales teams by controlling clearances that prevent fit-and-function failures such as squeak-and-rattle.
- Tolerance optimization: Tolerance optimization tunes limits to their most cost-effective values through simulation, cutting over-tight and out-of-spec cost for design and process engineering.
- Supplier and cross-team alignment: Supplier and cross-team alignment conveys required accuracy to vendors and aligns design, quality, and manufacturing on the same targets, cutting miscommunication-driven rejects for procurement and supplier quality.
Uncontrolled tolerance stack-up surfaces late, producing assembly difficulties and functional failures that compound through scrap, rework, engineering changes, tooling delays, warranty claims, recalls, and lost sales. Problems missed in early design lock in and correct only reactively through inspect-and-reject, when correction costs the most.
What Is the Dimensional Management Process?
The dimensional management process is a closed-loop workflow that controls dimensional variation across the product lifecycle through 4 activities (design, simulate, measure, and control). This closed-loop workflow feeds as-built measurement data back to design, which makes the process preventive rather than reactive. These activities run as 5 ordered steps, described below.
- Define datums and datum reference frames: Establish primary, secondary, and tertiary datums locating every feature for dimensioning, measurement, and assembly. RD8 Software helps to sanity check and ensure that there is a clear datum scheme between all parts in the assembly.
- Identify key product and control characteristics: Select key product characteristics (KPCs) critical to fit, function, and safety and the key control characteristics (KCCs), process parameters holding them on target. The Critical-to-Quality framework is a systematic method to break down user needs to KKCs.
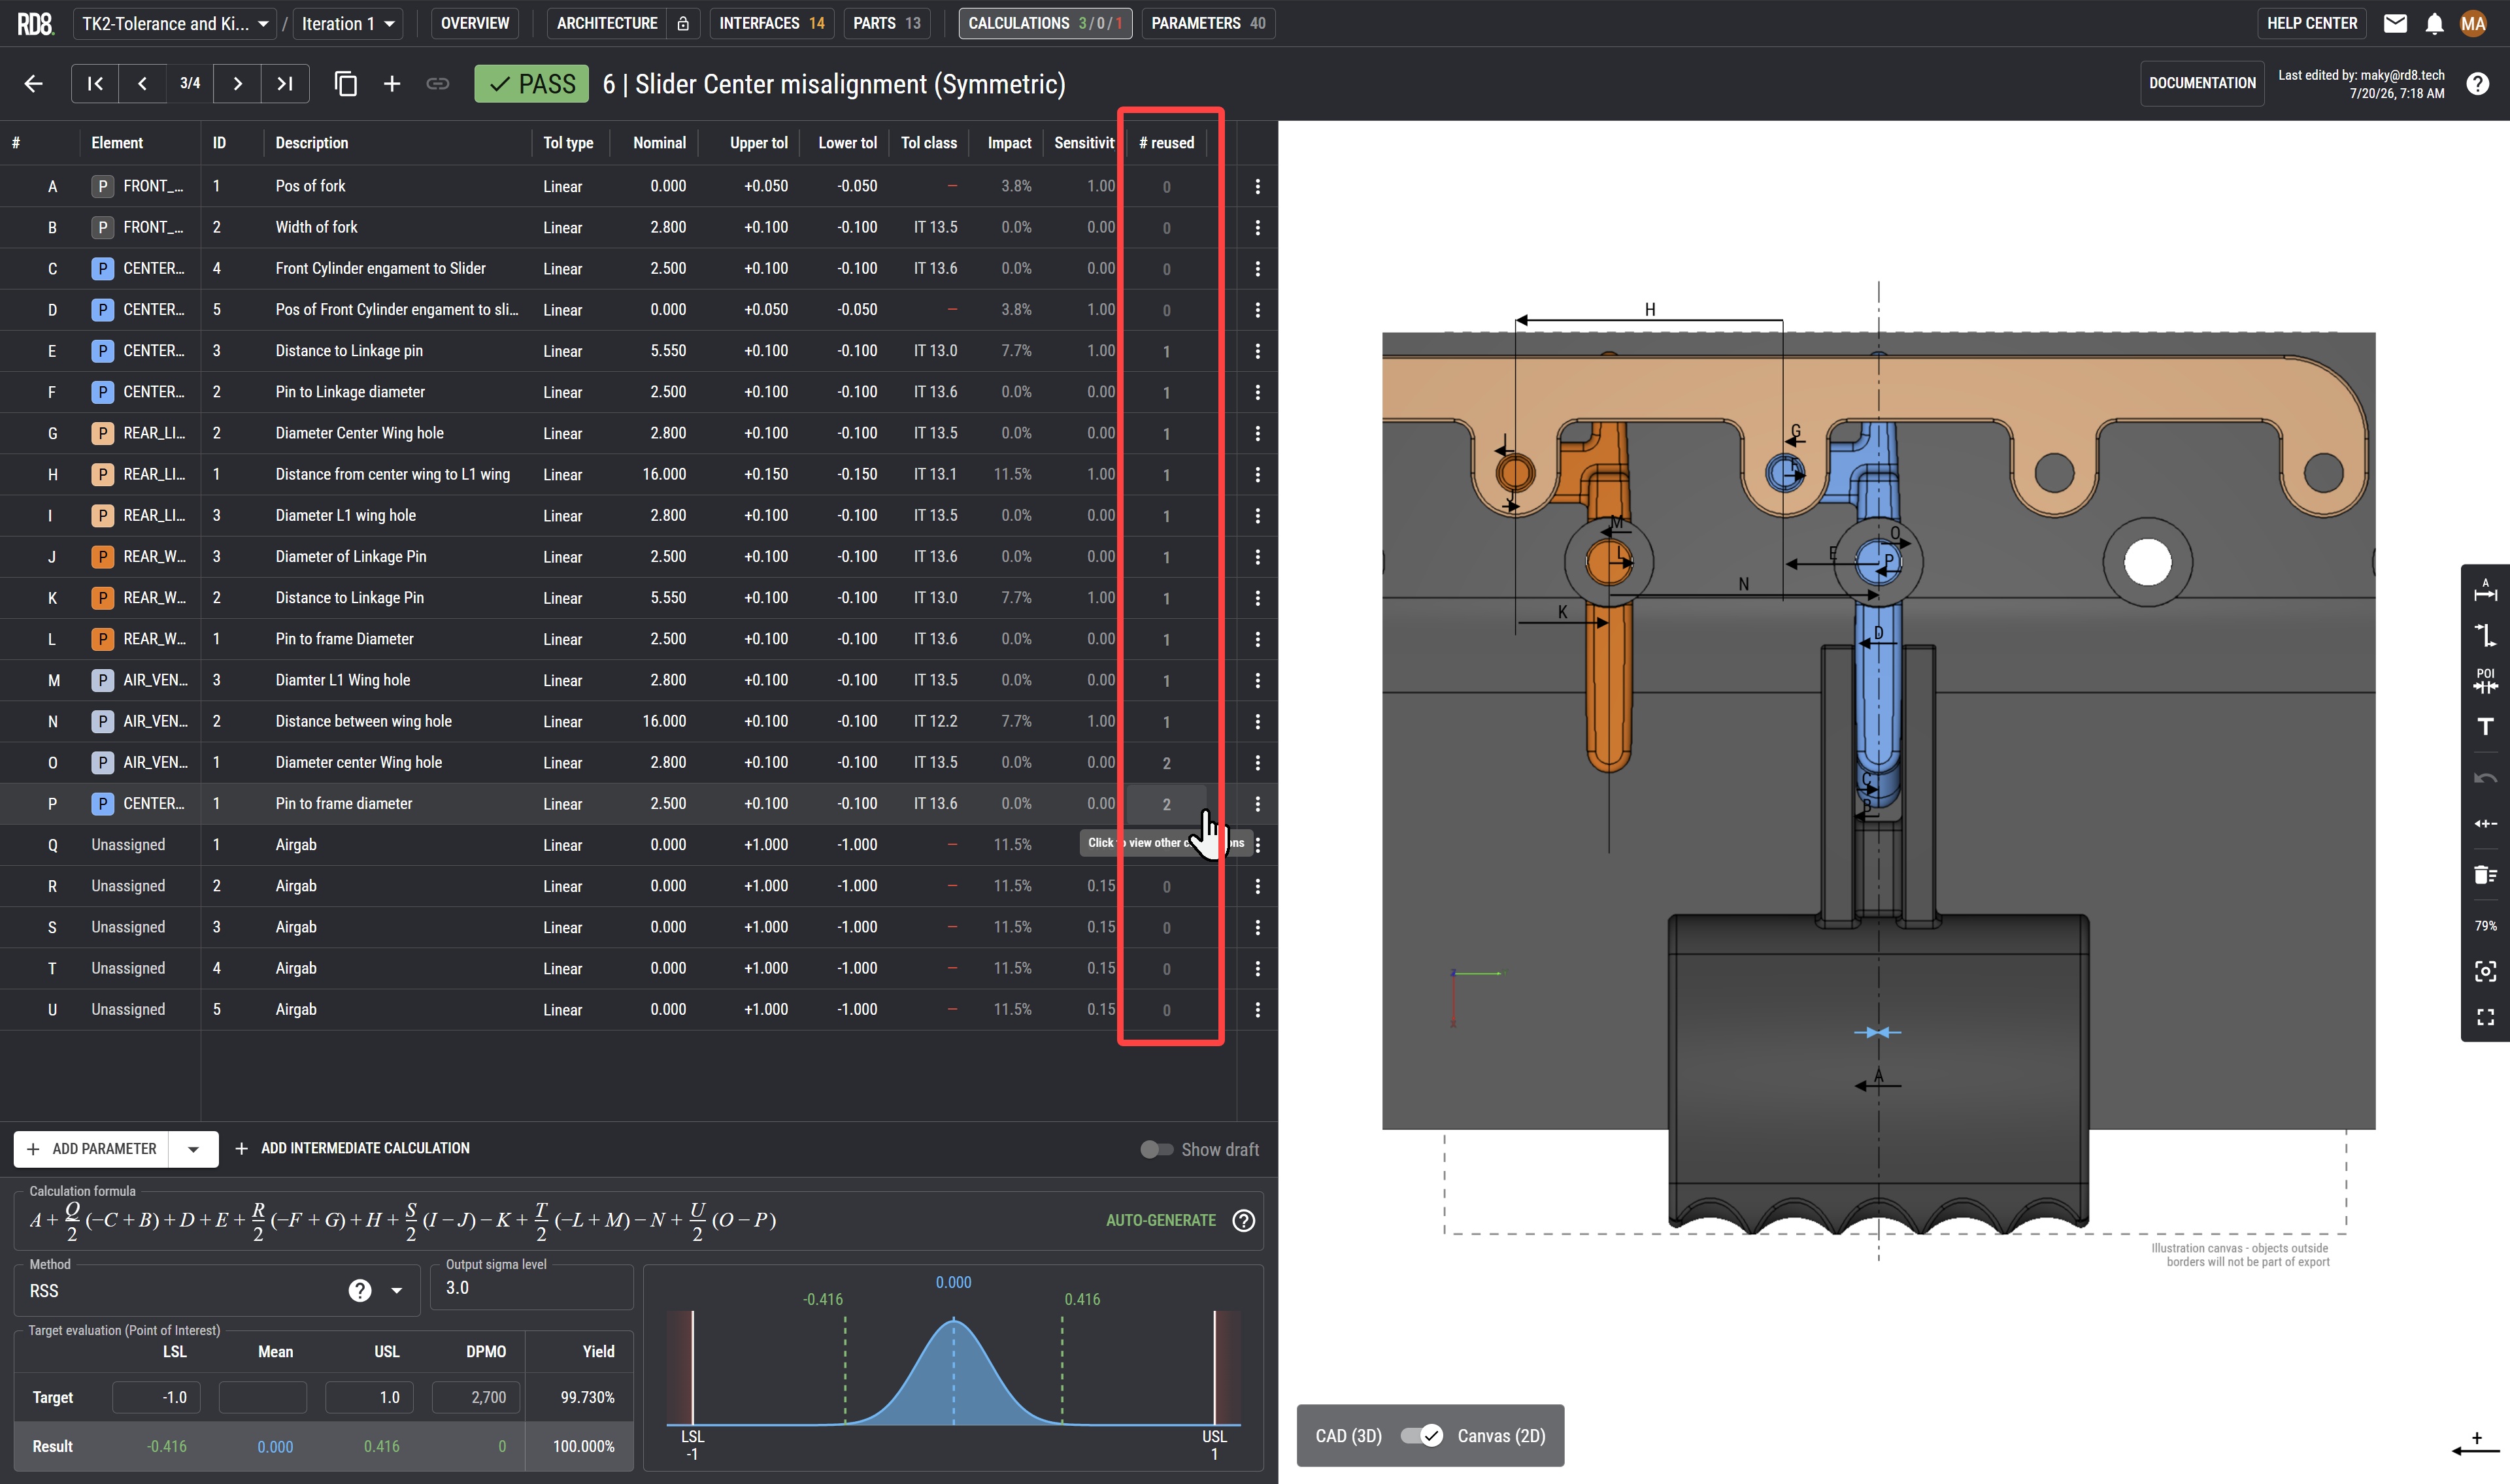
- Run tolerance stack-up and variation simulation: Predict tolerance accumulation along assembly paths using worst-case and statistical Monte Carlo methods, forecasting yield, Cpk, and top variation contributors before tooling. RD8 Software is built for this.
- Measure manufactured parts and inspect for conformance: Verify as-built parts and assemblies against the datum reference frame and GD&T with coordinate measuring machines (CMMs), optical scanners, and laser trackers.
- Validate and improve through measurement feedback: Correlate measured results against simulation predictions, feeding data back to design to validate models and improve continuously. Close the feedback loop in RD8 Software.
Define Datums and Datum Reference Frames
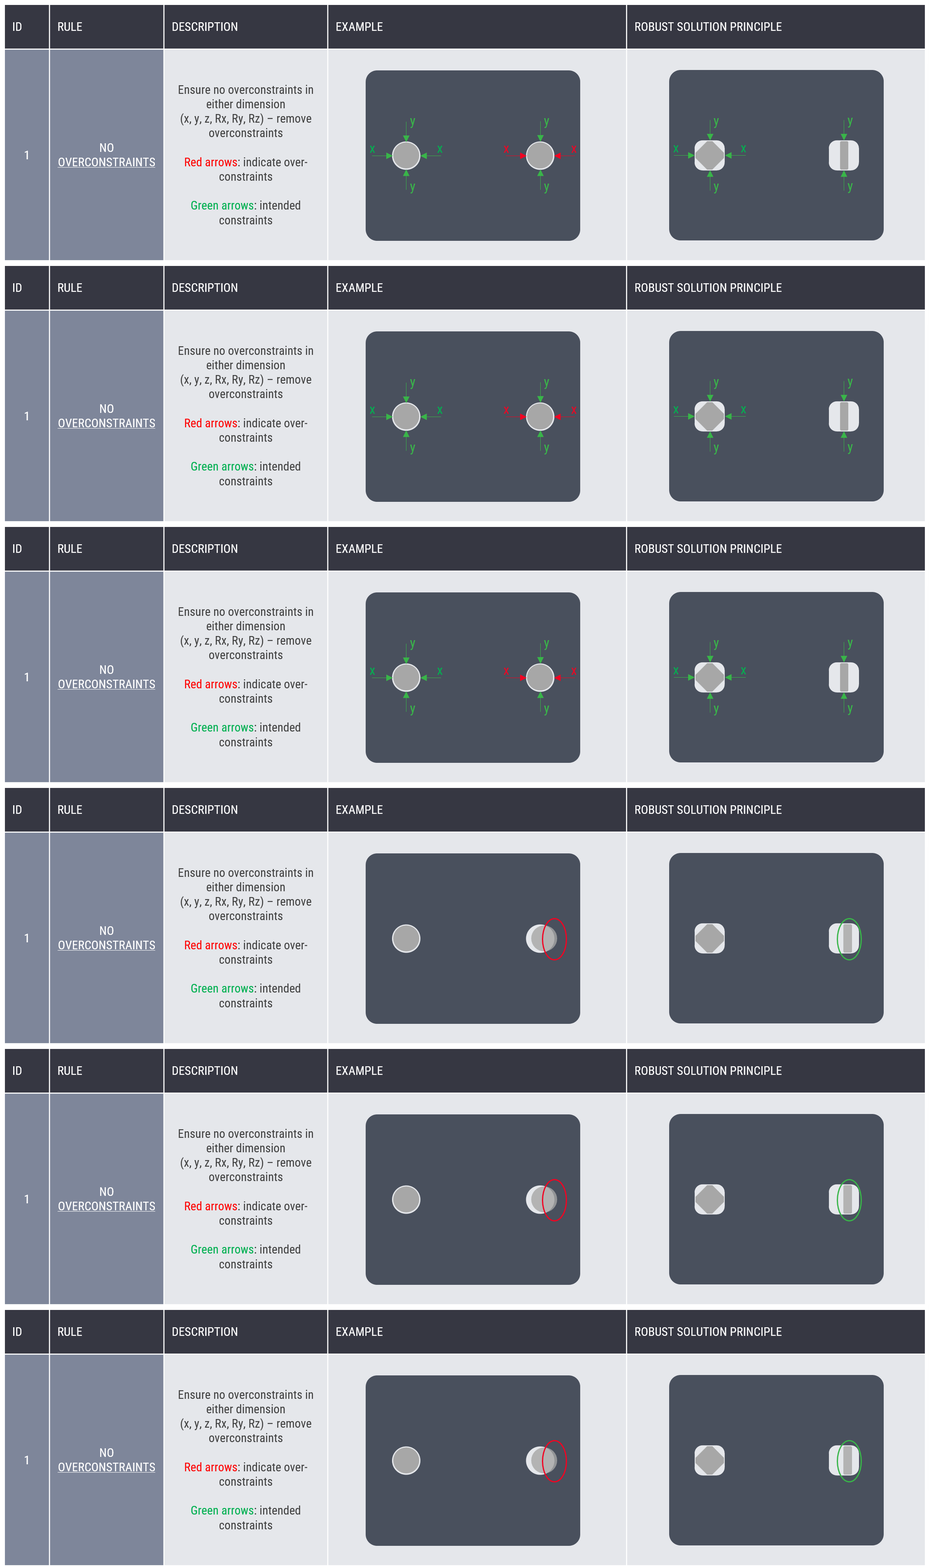
This scheme is foundational because every tolerance, stack-up path, and inspection result is meaningful only relative to its referenced datums. A locked frame governs measurement repeatability, part functionality, and consistent tolerance interpretation across design, manufacturing, and inspection. An ambiguous DRF produces datum shift and inconsistent readings that propagate error downstream. The datums are thus foundational meronyms of the dimensional management workflow.
These Tasks build the frame from real part surfaces carrying assembly functions.
- Identifying functionally important surfaces: the mating faces, holes, and features governing how the part locates in the assembly. RD8 Software automatically identifies functional surfaces in an assembly based on a given interface criterion (the interface definition, that can be defined for each interface)
- Selecting datum features for design intent: the real surfaces serving as datum features, tied to how the part mates. In RD8 Software the user can define the design intent by degrees of freedom and ideal functional surfaces (in the RD8 Interface Analysis Canvas).
- Establishing the primary, secondary, and tertiary hierarchy: the primary orients the part, the secondary and tertiary locate the remaining directions, applying the 3-2-1 locating rule. RD8 Software automatically turns the detected functional surfaces into a locating scheme and point out any unclarities.
- Constraining all 6 degrees of freedom: 3 translational and 3 rotational, verifying the sequence fixes the part fully and repeatably. RD8 Software evaluates all 6 degrees of freedom and points out any overconstraints or underconstraints directly onto the CAD model.
- Applying datum feature callouts: marks datum feature symbols and documents the locating and fixturing scheme.
- Sequencing for inspection and manufacturing repeatability: orders the datums around how the part is held and measured.
The work is primarily done in CAD (in model-based-definition (MBD) environments and 2D drawing modules), applying datum feature symbols and datum targets per ASME Y14.5. Datum feature simulators, the fixtures, surface plates, and gauge elements simulating the ideal planes and axes, realize the theoretical datums, while computer-aided tolerancing software consumes the scheme for variation simulation.
The DRF anchors the next step, identifying key product and control characteristics. A key product characteristic is a feature located and oriented relative to the datums, meaningful only within the DRF. Engineers select which datum-referenced features are critical to fit and function (not randomly), then trace them to the process parameters holding them on target.
Identify Key Product and Control Characteristics
This selectivity makes the process cost-effective, because limited engineering and inspection resources go where variation matters most. Tolerance simulation has no targets to optimize against without KPC and KCC designation (how would you optimize for X if you don’t know the target?). Control plans monitor everything or nothing without a clear plan (parameters and targets).
The characteristic-identification activities of this step are described below.
- Assemble a cross-functional team: design, quality, and manufacturing review specifications and agree on the critical characteristics.
- Identify functions and failure modes: work the design failure mode and effects analysis (DFMEA) for functions, failure modes, effects, and severity, tracing each failure to a design feature.
- Designate KPCs: select the features and dimensions critical to safety, regulation, fit, form, or function, applying the organization's severity or severity-and-occurrence thresholds.
- Flow KPCs into the process FMEA: carry each KPC into the process failure mode and effects analysis (PFMEA) and process flow to find its driving parameters.
- Designate KCCs: identify the process parameters significantly affecting each KPC, held to a target to keep it on nominal.
- Assign targets and tolerances: set the nominal value and allowable variation for each characteristic.
- Document critical parameters: record the KPCs and KCCs on the drawing or model and carry them into the control plan for tighter-than-standard monitoring.
The designated KPCs target the next step, tolerance stack-up and variation simulation, which predicts whether accumulated part and process variation holds each KPC within specification. The KCCs supply the process inputs feeding those predictions, and the datum reference frame from the prior step gives tolerance analysis its measurement objectives.
Run Tolerance Stack-Up and Variation Simulation
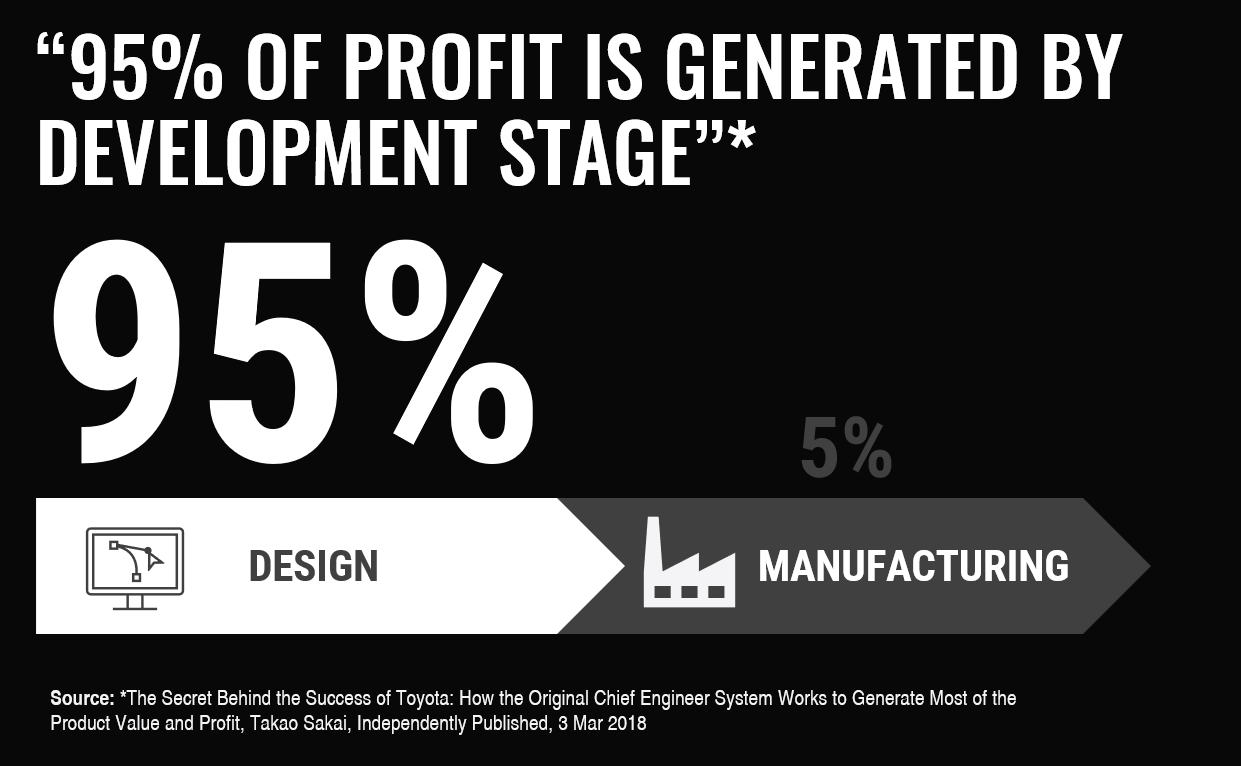
Variation simulation makes dimensional management preventive rather than reactive. Predicting variation while the design is editable catches fit, function, and assembly problems before tooling, when the fix costs far less than it does on manufactured parts. Variation simulation prevents over-design, since worst-case analysis tightens tolerances enough to spike part cost by 50 to 100 percent, whereas statistical methods show where tolerances safely loosen. The logic is related to the number of critical tolerances on parts which drives additional complexity for function, manufacturing and assembly. Takao Sakai states that 95% of profit is stated in the design, not by manufacturing. Martin Ebro et al. states that +72% of ramp up errors are rooted to mechanical design issues. RD8 cost reductions benchmarks ranges from 5% - 95% (in extreme cases) but is typically in the range of 5%-20%. A tolerance analysis converts the datum strategy and selected KPCs into an evidence-based numeric verdict on first-time-right assembly.
Tolerance stack-up and variation simulation run the following modeling and analysis tasks.
- Tolerance loop construction: tolerance loop construction identifies the assembly path of features and tolerances determining each target dimension, gap, or flush.
- Nominal and tolerance assignment: nominal and tolerance assignment populates each contributor with its nominal value and tolerance band from the GD&T model-based definition.
- Analysis method selection: analysis method selection chooses worst-case, root sum square (RSS), or Monte Carlo by process capability and risk. All can be chosen in RD8 Software.
- Statistical distribution assignment: statistical distribution assignment models each tolerance as a distribution from process capability data for RSS and Monte Carlo. Can be specified in RD8 Software.
- Simulation execution: simulation execution computes the worst-case or RSS stack, or samples across thousands of virtual assemblies. RD8 Software simulates million of samples in seconds.
- Result evaluation: result evaluation compares predicted variation against the assembly limit and reads yield, defect rate, and Cpk. RD8 Software automatically returns this information in a user-friendly interface.
- Sensitivity analysis: sensitivity analysis ranks the tolerances contributing most variation. Automatically provided to the user in the RD8 Software.
- Tolerance reallocation: tolerance reallocation tightens high-contributor tolerances, loosens low-impact ones, or changes the datum scheme, then re-runs. RD8 Software allows the users to tweak and test different scenarios, live, in a draft (sandbox) mode.
2 method families apply. Worst-case analysis sums the tolerance extremes, guaranteeing 100 percent conformance but conservative and over-designing. RSS produces stacks that are tighter than worst-case, while Monte Carlo samples across thousands of virtual assemblies. Both run at 1D, 2D, and 3D, automated by computer-aided tolerancing software including RD8 Software.
Measure Manufactured Parts and Inspect for Conformance
Conformance measurement confirms whether the tolerance scheme and variation simulation hold once tooling wear, process drift, and fixture error enter, which a simulation cannot fully anticipate. This conformance verification gates first-time-right assembly, catching nonconformances early.
The planning, measurement, and evaluation tasks and how each contributes are outlined below.
- Prepare the measurement plan: The measurement plan, generated from the variation-simulation model, defines which features, KPCs and high-variation contributors, to measure, plus the datum reference frame, sample size, and instrument.
- Establish the datum alignment: Datum alignment locates the part to its datum reference frame so measured coordinates match the drawing's coordinate system.
- Perform first article inspection: First article inspection fully measures the first part off the line, confirming the process produces conforming parts before full production.
- Measure the features: Feature measurement captures actual dimensions against nominal values and tolerances with the chosen probing, scanning, or optical instrument.
- Evaluate GD&T conformance: GD&T conformance evaluation assesses flatness, perpendicularity, true position, runout, concentricity, and profile against the callouts.
- Compute process capability: Process capability computation derives Cp and Cpk from repeated measurements, quantifying process spread and centering.
- Disposition non-conformances: Non-conformance disposition flags out-of-tolerance features and datum violations, recording deviations for corrective action.
3 metrology technologies cover this step. Coordinate measuring machines (CMMs) probe for 3D coordinates and are the gold standard for GD&T evaluation, reaching internal features like bores that optical methods miss, at lab-grade accuracy of roughly plus or minus 1.5 to 3 micrometers with full ISO 10360 traceability. Machine vision and optical systems deliver non-contact 100 percent inline measurement at repeatability of roughly plus or minus 10 to 100 micrometers, but miss internal features and depend on reflectivity and lighting. Laser and structured-light scanning capture point-cloud data without contact, suiting freeform and delicate surfaces. Measured data reduces to Cp, spread against the tolerance zone, and Cpk, spread plus centering, with Cpk of at least 1.33 the acceptance threshold for a capable process (as a rule of thumb).
Closed-loop validation correlates the conformance results, deviations, and Cpk against the variation-simulation predictions to confirm the design-stage models or reveal where capability diverges. The inspection report feeds as-built evidence to refine tolerance schemes and inform process control.
Validate and Improve Through Measurement Feedback
This correlation turns dimensional management from an open-loop exercise into a continuous, self-correcting discipline. The correlation validates design assumptions or exposes diverging capability before that divergence drives scrap, rework, or line-down. The captured practices preserve institutional knowledge and sustain first-time-right assembly across programs.
The measurement-feedback activities are described below.:
- Aggregate as-built data: Aggregate CMM and inspection results with computed Cp/Cpk into a quality-data repository.
- Correlate predicted versus actual variation: Correlate simulation results (predicted range, yield, Cpk) against measured results per KPC.
- Validate or adjust parameters: Validate the as-designed model where it matches, or retune distribution assumptions and tolerance inputs to measured capability.
- Identify divergence and root cause: Identify features exceeding predicted variation and trace the source to tooling, fixture, or process drift.
- Refine models and tolerance schemes: Refine the tolerance allocation, datum scheme, or design to validate capability.
- Capture and reuse best practices: Capture validated simulation and manufacturing practices for subsequent products.
The correlation of these mapped predicted and measured features runs inside computer-aided tolerancing software and a linked quality-data-management layer. Process capability tracking trends Cp/Cpk against predictions. Statistical process control (SPC) monitors stability over time. Sensitivity analysis isolates which contributors to retune where production exceeds predicted variation. RD8 Software can be used for this correlation and match.
Measurement feedback feeds its validated outputs forward into concept and design rather than to a later step. This feed-forward informs datum strategy, KPC and KCC selection, and the next variation simulation, so each program begins from production-validated parameters.
Takes 3 min - 15 Questions - Get Instant Results
How Does Dimensional Management Span the Product Lifecycle?
Dimensional management runs as a continuous, closed-loop activity across the product lifecycle. Dimensional management's 4 core activities, design, simulate, measure, and control, repeat from concept through series production and inspection. Early-design predictions are validated against as-built results, and the design improves on that evidence. This lifecycle span separates dimensional management from draw-then-inspect tolerancing, which fixes dimensions once and checks them only after production.
Dimensional management contributes distinct activities, objectives, and outputs across the 6 lifecycle stages below.
- Concept and early design: Concept and early design set dimensional targets, gap-and-flush plans, functional dimensions, datum reference frames, and KPCs and KCCs before geometry freezes. This locks a robust locating strategy early, when roughly 95% of product cost is committed in the first stages of product development (Source: *The Secret Behind the Success of Toyota: How the Original Chief Engineer System Works to Generate Most of the Product Value and Profit, Takao Sakai, Independently Published, 3 Mar 2018). Outputs are the datum scheme, KPC and KCC list, and dimensional-management plan.
- Design definition: Design definition applies GD&T to models per ASME Y14.5 or ISO GPS as model-based definition. It fixes allowable variation unambiguously for manufacturing and inspection, since ambiguous tolerances block downstream analysis. Outputs are fully toleranced models and simulation-feeding tolerance schemes.
- Simulation and variation analysis: Simulation and variation analysis run 1D, 2D, and 3D tolerance stack-up, worst-case and statistical Monte Carlo. This confirms target Cpk and catches an incapable stack-up before tooling is cut. Outputs are predicted yield and Cpk, a variation-contributor sensitivity ranking, tolerance-reallocation decisions, and measurement-plan inputs.
- Tooling and pre-series: Tooling and pre-series optimize product and process, define build fixtures, finalize measurement plans, and validate first articles against design intent. This cuts prototypes, since tooling that cannot hold the KCCs fails the program. Outputs are validated fixtures, measurement plans, and go-or-adjust decisions.
- Series production and control: Series production and control measure parts with CMM, optical, and laser-scanning metrology and run Statistical Process Control (SPC) monitoring and error analysis. This confirms KPC conformance and catches drift or special-cause variation before scrap or a line-down. Outputs are inspection reports, capability data, deviation lists, and corrective actions.
- Feedback and closed loop: Feedback and closed loop correlate as-built results against simulated predictions and loop back to adjust build objectives, strategies, or tolerances. This validates early assumptions and drives improvement over a dead-end pass or fail. Outputs are corrected models, updated methodology, and improved targets for the next program.
Lifecycle-wide dimensional management outperforms point-in-time activity because variation is cheap to fix only upstream, where early-design prediction catches tolerance problems, yet confirmed only downstream by production measurement. A point-in-time activity captures one and misses the rest, so it reacts only after scrap and rework accrue. The closed loop prevents variation instead of detecting it.
What Tools Are Used for Dimensional Management?
Dimensional management uses an integrated toolset of tolerance analysis, measurement, and design-authoring software mapped to 4 activities across the design-to-conformance loop. The toolset falls into 3 categories because no single tool covers the discipline.
Each category and the activity it supports is described below.
- Tolerance analysis software: computer-aided tolerancing software handles variation analysis. computer-aided tolerancing software predicts tolerance stack-up and simulates variation on the 3D model, so engineers catch contributors before tooling is cut. RD8 Software is your companion to set-up and analyze tolerance stacks.
- Measurement and metrology tools: Measurement and metrology tools handle dimensional measurement. Metrology tools verify as-built parts and assemblies against the datum reference frame and GD&T, then feed variation data back to design.
- CAD and PLM systems: CAD and PLM systems handle design definition and product-data management. CAD and PLM systems author, version, and share geometry, GD&T, and model-based definition as the authoritative record that feeds analysis and measurement.
Tolerance Analysis Software
Tolerance analysis software, called computer-aided tolerancing software, predicts dimensional-variation accumulation through an assembly and whether the result stays within functional limits before any part is made. computer-aided tolerancing software automates dimensional management's simulate-and-analyze core, testing variation against KPC and KCC targets set upstream.Tolerance analysis software sits in a closed loop between the CAD/PLM backbone and production measurement systems. The computer-aided tolerancing tool runs alongside CATIA, Siemens NX, PTC Creo, and SOLIDWORKS, reading geometry and GD&T through model-based definition or by exports of CAD and parameter-data. As-built measurement data feeds back to correlate design assumptions with measured capability. Selecting the right tolerance analysis software depends on this integration reach.
Tolerance analysis software delivers dimensional management's benefits of quality, cost control, and first-time-right assembly by simulating variation before tooling is cut. The computer-aided tolerancing tool reduces scrap, rework, and late design changes and shortens time to market. The rule of thumb is that every dimensional issue found in manufacturing costs 10 times more to fix than one caught in design.
These capabilities and the activity each supports are described below.
- Tolerance stack-up analysis: Tolerance stack-up analysis sums component tolerances along an assembly path to confirm a dimension or gap stays within limits, supporting variation prediction. RD8 Software is made to make tolerance analysis swift and easy.
- 1D-3D variation simulation: 1D-3D variation simulation models tolerances as statistical distributions across thousands of Monte Carlo builds, supporting statistical analysis by predicting yield and process capability rather than worst-case estimates. RD8 Software does this in seconds when the analysis is set up.
- Worst-case and statistical methods: Worst-case and statistical methods quantify variation 2 ways, supporting method selection so engineers guarantee conformance or predict yield per characteristic. In RD8 Software users can choose multiple evaluation methods.
- Sensitivity and contribution analysis: Sensitivity and contribution analysis ranks the tolerances driving most variation, supporting tolerance allocation by tightening where it matters and relaxing elsewhere to cut cost. RD8 Software automatically gives this insight when a model is set up.
- GD&T validation on the model: GD&T validation on the model tests geometric dimensioning and tolerancing on the 3D model, supporting design definition by confirming the tolerancing scheme is complete before release. RD8 Software is compatible with ISO GPS/GD&T notation.
Measurement and Metrology Tools
Measurement and metrology tools are the precision instruments and inspection software that verify as-built parts and assemblies against their dimensional and GD&T requirements. Measurement and metrology tools capture real geometry relative to the datum reference frame and produce the as-built data that closes the loop back to design.
These instruments execute the measure and inspect step across first-article and batch inspection, tooling and fixture checks, and freeform-surface deviation capture. They verify GD&T characteristics such as position, concentricity, flatness, and profile. Their output feeds the measurement-feedback step and correlates variation against the simulation to confirm KPCs and process capability (Cpk).
The core capabilities of these tools, and the dimensional management step each one supports, follow below.
- Coordinate measuring machines (CMMs): CMMs compute holes, planes, and cylinders from X-Y-Z coordinates at the highest accuracy. They support lab GD&T verification of small-to-medium parts and deliver first-article and batch conformance data.
- Portable measuring arms (PCMMs): PCMMs use encoded articulation to measure features against the arm base within a 3-meter shop-floor volume. They support in-process inspection after machining and give fast part-to-CAD comparison.
- Laser trackers: Laser trackers locate 3D positions over tens of meters within tens of microns from one setup. They support large-assembly alignment in aerospace, shipbuilding, and turbine work with real-time positional feedback.
- Optical and laser 3D scanners: Optical and laser 3D scanners project structured-light or laser-line patterns to capture dense point clouds of whole surfaces. They support surface-deviation analysis of freeform parts and produce color deviation maps against the CAD nominal.
- Inspection and analysis software: Inspection and analysis software best-fits captured data to the CAD nominal, evaluates GD&T, and generates conformance reports. It supports the conformance-decision and reporting step and turns raw measurement into pass/fail data. This can be done in conjunction with RD8 Software.
Inspection software generates measurement programs from CAD models and model-based definition, so embedded GD&T drives measurement and conformance judgment. Metrology platforms return results to the manufacturing execution system (MES), enterprise resource planning (ERP), and PLM for monitoring and traceability, and to tolerance analysis software. Measurement therefore sits between the CAD/PLM record and computer-aided tolerancing simulation, completing the design, simulate, measure, control loop.
Measurement and metrology tools catch non-conformance before the customer, which gives dimensional management its conformance evidence and supports quality and compliance. Returned as-built data lets teams refine tolerance schemes and raise process capability instead of running inspect-and-reject cycles. Matching the instrument to the part keeps measurement accurate, cuts rework, and speeds diagnosis.
CAD and PLM systems
CAD, Tolerance Analysis Software and PLM systems are the backbone of dimensional management, supporting the design-definition and data-management activities bracketing its loop. CAD and PLM systems divide this work, with CAD authoring 3D geometry, datums, features, and GD&T defining design intent (as MBD embedding tolerances in the model or in 2D documentation), while PLM versions, releases, and routes that model with its tolerance schemes, dimensional management plans, KPC and KCC definitions, variation-simulation reports, and measurement results.
CAD and PLM systems exchange data with tolerance analysis software and metrology tools. Tolerance analysis reads geometry and GD&T from CAD. RD8 Software runs in conjunction with CATIA, Siemens NX, PTC Creo, and SOLIDWORKS. Variation simulation runs based on model data. Metrology software builds inspection programs from the CAD/MBD model and returns as-built results to PLM for traceability. STEP AP242 (ISO 10303-242) carries semantic PMI and GD&T across vendor boundaries, synchronizing mixed toolchains.
CAD and PLM systems give dimensional management a single source of truth. Manufacturing and quality reference one authoritative record rather than reconciling drawings against CAD, cutting interpretation errors and rework. PLM version control and data flow align every team to the current design, preventing drift from stale or duplicated data and enabling the closed loop.
The CAD and PLM capabilities and the dimensional management activity each supports are listed below.
- 3D geometry and GD&T authoring: 3D geometry and GD&T authoring creates the parts, assemblies, datums, and geometric tolerances that define design intent, the design-definition step.
- Model-based definition: Model-based definition embeds GD&T, tolerances, and product manufacturing information in the 3D model as the authoritative source feeding tolerance analysis and inspection.
- Product-data and version control: Product-data and version control stores, versions, and releases the model and its dimensional data, holding every team to the current record during data management.
- Cross-lifecycle data flow: Cross-lifecycle data flow routes dimensional data across design, simulation, manufacturing, quality, and CAM and CMM programming, sustaining the closed loop.
- Interoperability through neutral formats: Interoperability through neutral formats such as STEP AP242 carries semantic PMI and GD&T across tools for CAD-agnostic exchange.
Takes 3 min - 15 Questions - Get Instant Results
What Standards Govern Dimensional Management?
Dimensional management is governed by 2 standard systems, ASME Y14.5 in North America and the ISO GPS suite internationally. Both standard systems formalize GD&T, the symbolic language specifying allowable variation on drawings and models. A named standard makes each dimensional requirement unambiguous and verifiable.
A governing standard defines a feature's allowable variation through symbols, tolerance zones, and datum references. The governing standard fixes how that intent is communicated in drawing and model notation, and how conformance is verified through measurement and interpretation rules at inspection. A supplier, a machinist, and a metrologist measure one drawing differently absent a named standard, breaking design-to-inspection consistency.The 2 standard systems and what each defines are described below.
ASME Y14.5
ASME Y14.5 is the North-American dimensioning-and-tolerancing standard, a single comprehensive document defining the GD&T language of symbols, feature control frames, datums, and rules. The ASME standard is function- and manufacturability-focused.ISO GPS
ISO GPS is an ISO family of interlinked standards, keyed on ISO 8015 fundamentals, ISO 1101 geometric tolerances, and ISO 5459 datums, governing geometric specification and verification. The ISO GPS suite is metrology- and mathematics-focused, built on the Independence Principle, and covers gauging, acceptance tests, and measurement-system calibration.
The 2 systems are not interchangeable. The 2 standard systems differ on default rules, where ASME Y14.5 applies Rule #1 envelope control and ISO GPS the Independence Principle. The 2 standard systems also differ on datum definition, where ISO 5459 is more mathematically explicit. Conformance to one does not guarantee the other, so the title block names one governing standard per program, applied end to end and never mixed on a feature.
How Does GD&T Support Dimensional Management?
GD&T supports dimensional management by defining and controlling allowable geometric variation at the feature level. GD&T states, per critical feature, how much it may deviate and against which references, letting dimensional management hold accumulated variation across the lifecycle. Feature control frames carry that statement, bounding variation by design intent rather than plus/minus limits. These machine-readable callouts feed tolerance stack-up, variation simulation, and measurement planning. GD&T, or geometric dimensioning and tolerancing, is the language. Dimensional management is the discipline that acts on GD&T.GD&T communicates design intent through a symbolic notation every trained reader decodes identically, so one drawing carries the requirement to machinists, suppliers, and inspectors. Basic dimensions carry the feature's exact location, and the tolerance zone bounds its permitted deviation. Standardization by ASME Y14.5 or ISO GPS, named in the title block, holds this intent across teams, sites, and borders.
What Industries Use Dimensional Management?
Dimensional management applies to manufacturers of multi-component, tape-measurable products whose fit and function depend on tolerance stack-up. Dimensional management predicts and controls that variation across the lifecycle for first-build success, not at final inspection.
Each vertical's products, dimensional stakes, and adoption drivers are described below.
- Automotive: Automotive builds body-in-white, closures, powertrain and transmission components, and vehicle assemblies, stacking hundreds of stamped and welded tolerances across framing to govern gap-and-flush, sealing, wind noise, and alignment. Adoption follows process capability (Cpk), IATF 16949, and the Production Part Approval Process (PPAP), demanding dimensional results, capability studies, control plans, and SPC.
- Aerospace: Aerospace builds airframe and fuselage, wings, turbine and engine components, and control systems on tight tolerances and datum structures, where variation on aerodynamic and propulsion surfaces compromises critical-to-function and safety. Adoption follows AS9102 First Article Inspection, conforming parts to drawings, GD&T, and design intent before production, with traceable reporting.
- Industrial Products: Products for mass production. Consumer products or B2B products such as pumps, valves, locks, brackets, etc.
- Medical devices: Medical devices include implantable devices, surgical instruments, molded micro-scale assemblies, and combination products whose internal geometries keep critical characteristics controlled and need non-destructive evaluation of wall thickness and alignment. Adoption follows Food and Drug Administration (FDA) and ISO 13485 dimensional inspection across design verification, process validation, and production release, with traceable audit records.
What Are the Common Challenges in Dimensional Management?
The dominant dimensional management challenges, each with its lifecycle stage, impact, and mitigation, are described below.
- Tolerance stack-up accumulation: Tolerance stack-up accumulation adds part tolerances across design and assembly until gaps or fits fall out of specification, driving misalignment and rework. computer-aided tolerancing software (RD8 Software) predicts stack-up before tooling.
- Measurement-system error: Measurement-system error, a gauge imprecise against the tolerance band, causes false rejects of good parts and masks real defects. Gauge R&R (gauge repeatability and reproducibility) studies and matched gauges contain the error.
- Process-capability gaps: Process-capability gaps open at the design-to-manufacturing handoff when specifications exceed capability or go unvalidated, yielding chronic scrap and low Cpk. Process-capability studies and design-for-manufacturability review align specification with capability.
- Thermal and environmental variation: Thermal and environmental variation expands or contracts materials in manufacturing and measurement, drifting dimensions into inconsistent parts. Temperature-controlled inspection and environmental compensation reduce this drift.
- Cross-functional communication gaps: Cross-functional communication gaps span the lifecycle, misaligning GD&T, datum strategy, and inspection intent across design, quality, and manufacturing and causing inspection failures. Shared model-based definition and early collaboration close these gaps.
- End-of-line-only inspection without traceability: End-of-line-only inspection without traceability leaves teams unable to trace a defect's root cause, repeating escapes. In-process measurement and closed-loop feedback correct this gap.
How does Dimensional management support tolerance analysis and robust design?
Dimensional management is the lifecycle framework that predicts, controls, and reduces variation, which turns tolerance analysis and robust design into operational work rather than isolated calculations.
Dimensional management feeds tolerance analysis, the component activity that checks accumulated variation against assembly limits, giving that activity valid inputs and a path to act on results.
Dimensional management targets robust design, a product and process engineered to absorb variation without degrading function. computer-aided tolerancing software automates the prediction.
The key mechanisms dimensional management supplies, how each supports tolerance analysis and robust design, and the outcome each improves are described below.
- Datum strategy and KPC/KCC selection: Datum strategy and KPC/KCC selection define datum reference frames and variation-critical characteristics, giving analysis a function-anchored stack model and design its optimization targets. This sharpens prediction accuracy and design focus.
- 1D-3D variation simulation via computer-aided tolerancing software: 1D-3D variation simulation runs tolerance stack-up in tools such as RD8 Software before tooling exists, comparing design and process alternatives for robustness. This catches rework risk upstream and yields predictable assembly.
- Analysis-method choice: Analysis-method choice matches worst-case, statistical RSS, or Monte Carlo to the risk, setting analysis fidelity and design margin. Worst-case guarantees conformance but over-designs. RSS runs optimistic. Monte Carlo models tolerances as distributions across thousands of builds, avoiding over-design cost and under-design failure.
- Predicted Cpk with sensitivity ranking: Predicted Cpk with sensitivity ranking outputs the capability index and ranks top variation contributors, showing which tolerances to tighten and which to relax. This cuts variation where it matters and cost where it does not.
- Closed-loop measurement feedback: Closed-loop measurement feedback returns as-built data to design, validating simulation models against reality. This grounds design decisions in real process capability and sustains lifecycle variation control.
Combining these disciplines converts variation from a downstream defect risk into an upstream design variable. This combination moves engineering from inspect-and-reject to predict-and-prevent. The measurable gains are fewer redesigns, higher first-time-right yield, lower scrap, and shorter concept-to-market time.
Set up a free RD8 Software Trial for your team
Book an initial meeting to:
Let us know your contact details - and any additional clarification points - then we will get back as soon as possible.
By submitting, you accept RD8's Privacy Policy and Terms of Service.
