Tolerance stack-up Analysis: Definition, Methods, process, applications, and software
Tolerance stack-up analysis is the process of evaluating how part tolerances affect an assembly. Common methods include worst-case, RSS, statistical tolerancing, and Monte Carlo simulation. In short, you define requirements, identify critical dimensions, choose a method, and to check if the design meets its functional requirements.
It's widely used in industries like medical devices, automotive, aerospace, electronics and general manufacturing. Modern tools make the work faster and more accurate - including RD8 Tolerance Stack-Up Analysis Software, which helps optimize designs and streamline the tolerance stack-up analysis process.
Trusted by engineering teams building high‑performance mechanical products


What is tolerance stack-up analysis?
Tolerance Stack-Up analysis is the engineering process of evaluating how individual part tolerances accumulate in an assembly and how that accumulated variation affects functional performance and manufacturability. In practice, it quantifies the cumulative effects of dimensional variation so you can verify that parts will still fit, seal, align, move, and assemble as intended within real manufacturing limits. See the following parts of tolerance stack-up analysis to gain further insight
Primary Purpose of Tolerance Stack-Up Analysis
The primary purpose of tolerance stack-up analysis is to predict dimensional variation in critical features and ensure the design remains functional under real-world manufacturing variation. Done early, it helps teams ensure product quality, reduce manufacturing cost (by avoiding unnecessarily tight tolerances), and prevent assembly issues such as interference, misalignment, jamming, or poor fits that otherwise appear late in development.
What are the Core Principles of Tolerance Stack-Up Analysis?
Tolerance stack-up analysis is grounded in the principle of setting up a calculation - sometimes referred to as the the transfer function - but instead of only calculating the result - tolerances are applied to each parameter in the calculation - and hereby different results of the calculations can be achieved based on different assumptions.
- Dimensional tolerances (geometrical part dimensions - typically in mm, inches or degrees) - due to production, temperature, humidity, wear, or other means that can impact the part dimensions
- Other tolerances - e.g. material properties, assembly variation, user behavior, ...
But also how tolerances are specified and how analysis is made have an impact on the tolerance stack-up analysis:
- How geometry, datums and allowable form/orientation/location variation are specified and interpreted. Two main methods exist: GD&T and ISO GPS.
- Which tolerance distribution type that is used for each parameter in a calculation. Normal distribution, uniform distribution, etc.
- Which simulation approach is used to predict the result. Engineers commonly use foundational calculation approaches such as worst-case analysis and statistical simulation methods like Monte Carlo.
Key Objectives of Tolerance Stack-Up Analysis
- Identify how part tolerances accumulate in an assembly and which contributors drive variation the most.
- Quantify the potential variation in key dimensions (clearances, alignments, seals, stroke, force paths, etc.)
- Optimize tolerances for cost-effectiveness and functionality by balancing performance needs with process capability.
- Ensure compliance with design intent and assembly requirements, linking specifications to functional outcomes and manufacturability.

What is the Difference Between, Tolerance, Variation, and Stack-Up?
Tolerance Analysis is all about handling variation from different sources.
Many confuse variation and variance.
- Variance is a statistical measure - the lingo is deviations.
- Whereas variation is slightly change of a value (dimension, number, weigth, force, angle, etc.). E.g. The dimension of 10 mm has variation, means that the dimension can differ from 10 mm - e.g. 10.1 mm or 9.99.
To describe the range of expected variation we use the term tolerance. The tolerance defines the range of variation. In example a tolerance of +/- 1 mm for a 10 mm dimension would allow the dimension to be in the range from [9 mm; 11mm].
The term stack-up is used to describe what happens when a series of parameters are put together in a calculation - to estimate the total variation of a given case.
Why Tolerance Stack-Up Analysis Is Important in Engineering and Manufacturing
Tolerance stack-up analysis is critical because it enables predictive design by quantifying how variation from various sources will impact the given functional requirement before production. Thereby reducing production errors and improving product quality. In engineering and manufacturing, it turns tolerances from "numbers on drawings" into verifiable design control, helping teams make manufacturable decisions earlier with fewer costly iterations.
Key reasons why tolerance stack-up analysis matters
1D Tolerance Stack-Up Analysis
2D Tolerance Stack-Up Analysis
3D Tolerance Stack-Up Analysis
What are the types of tolerance stack-up analysis?
1D: The width of the boxes and cradles are in scope.
2D: Imagine that the parts are not perfect along the y-axis. Any variation here should be included.
3D: Imagine that possible variation in the depth (z-axis) is included.
What are the methods of tolerance stack-up analysis
Worst-Case Tolerance Stack-Up Analysis
Root Sum Square (RSS)
Statistical
Monte Carlo
How to do tolerance stack-up analysis
Tolerance stack-up analysis is done by defining the functional requirement, modelling how dimensional variation accumulates, and calculating whether the assembly still meets its limits under real life variation.
Overview Of How To Do Tolerance Stack-Up Analysis
- Define the critical output you want to control (e.g., clearance, alignment, seal compression, stroke, force transfer, gap, contact pressure) - and accompany it by an illustration and clearly mark the point of interest (POI).
- Set limits: specify the acceptable min/max output range, not just nominal targets.
- Clarify operating conditions: what matters at room temperature, at end-of-life wear, under load, after assembly, or after environmental exposure?
- Decide the quality target: is it 100% of all samples that may pass or only a fraction? Sigma-levels is often used to define an acceptance rate. The term Six Sigma is popular and refers to that 3.4 defects per million opportunities (DPMO) is accepted.
- Trace the path from start to end.
You need to connect "one side of the POI" to the "other side of the POI". - Define a positive direction of the stack and if it is vertical, horizontal or slantered.
- Clearly mark start- and end-points of dimensions by leader lines.
- Mark each dimension on the illustration and give it an ID for reference.
This is typically refered to as the main part of tolerance stacking, tolerance chain, tolerance stack-up analyis.
- Link the parameter to the illustration - match the notation.
- Link the parameter with the given part or subassembly.
- Add a description for each parameter.
- Add/link the ID of the parameter with technical drawing or 3D model.
- Add the nominal dimenion.
- Add the assumed tolerances or lookup the tolerance from a tolerance class.
- For GD&T/GPS: translate geometric modifiers to linear tolerances.
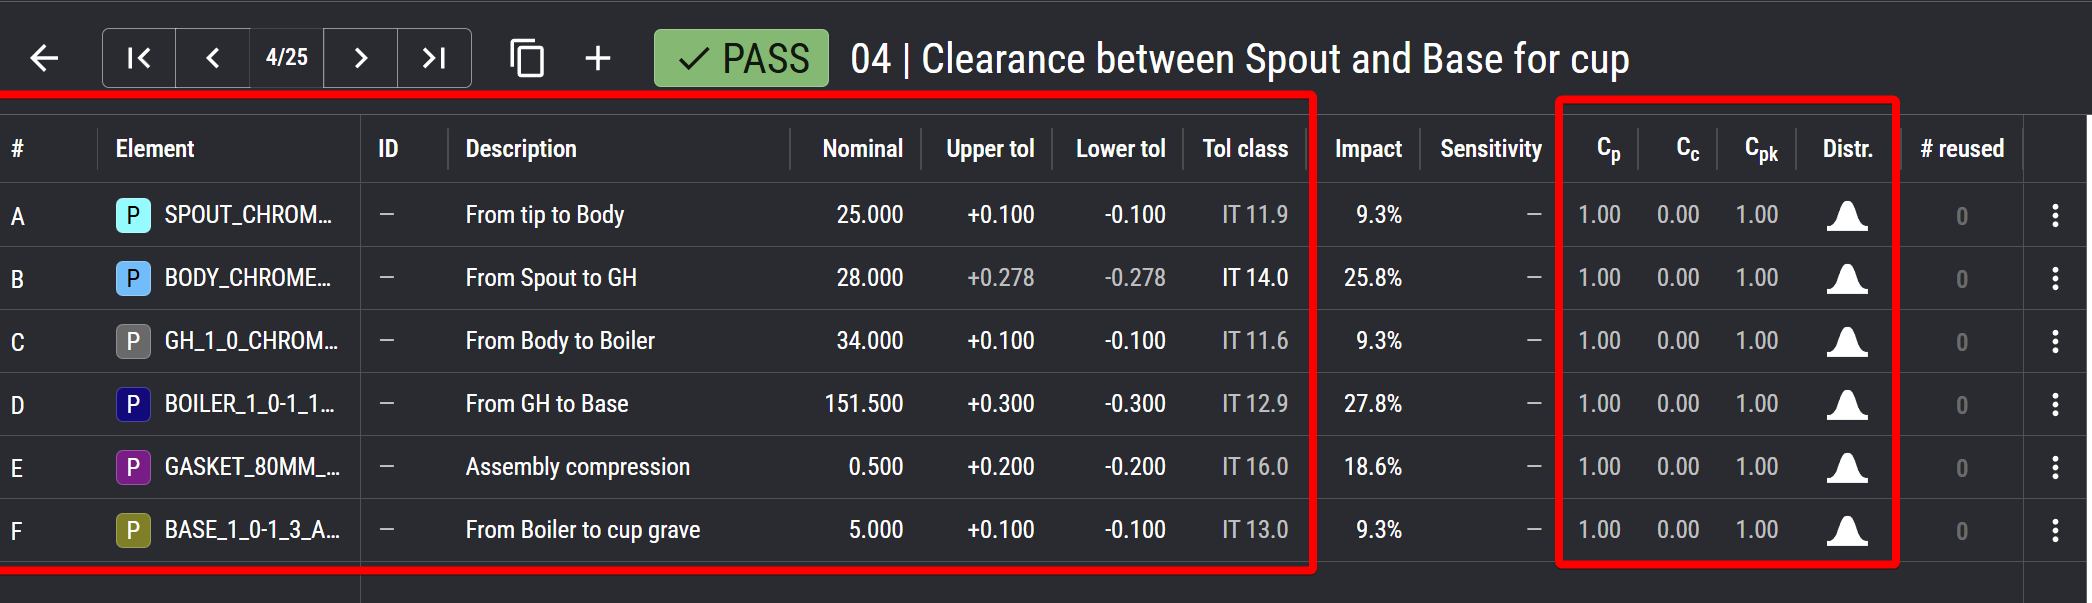
- Specify distribution type or add production data (Cp, Cc, Cpk).
All four are standard approaches in tolerance analysis, each offering a different balance between simplicity, accuracy, and how realistic the predicted assembly variation. See full details in the section above.
1. Worst Case (WC)
Maximum safety margin
- Typically used for fits (scope of two mating parts)
2. Root Sum Square (RSS)
- Typically used for assemblies with more than 2 parts.
- Typically a bit too optimistic.
3. Statistical
- RSS approach - but taking process capability parameters into account (Cp, Cc, Cpk)
- Typically used for more precise estimates than a simple RSS if Monte Carlo functionality is not available (in an excel sheet or similar).
4. Monte Carlo
- Best for assemblies with more than 2 components.
- Best for most realistic estimates.
The calculation is often refered to as the 'transfer function', 'the calculation model', 'total tolerance', 'tolerance accumulation', or 'tolerance equation'.
The calculation can be of different types:
- 1D stack: refered to as a plus/minus calculation based on geometrical dimensions.
- 2D and 3D stacks: more complex geometrical stacks that includes e.g. angles.
- Unlinear stacks: where a geometrical stack is enriched with other parameters, e.g. to calculate pressure, force or momentum.
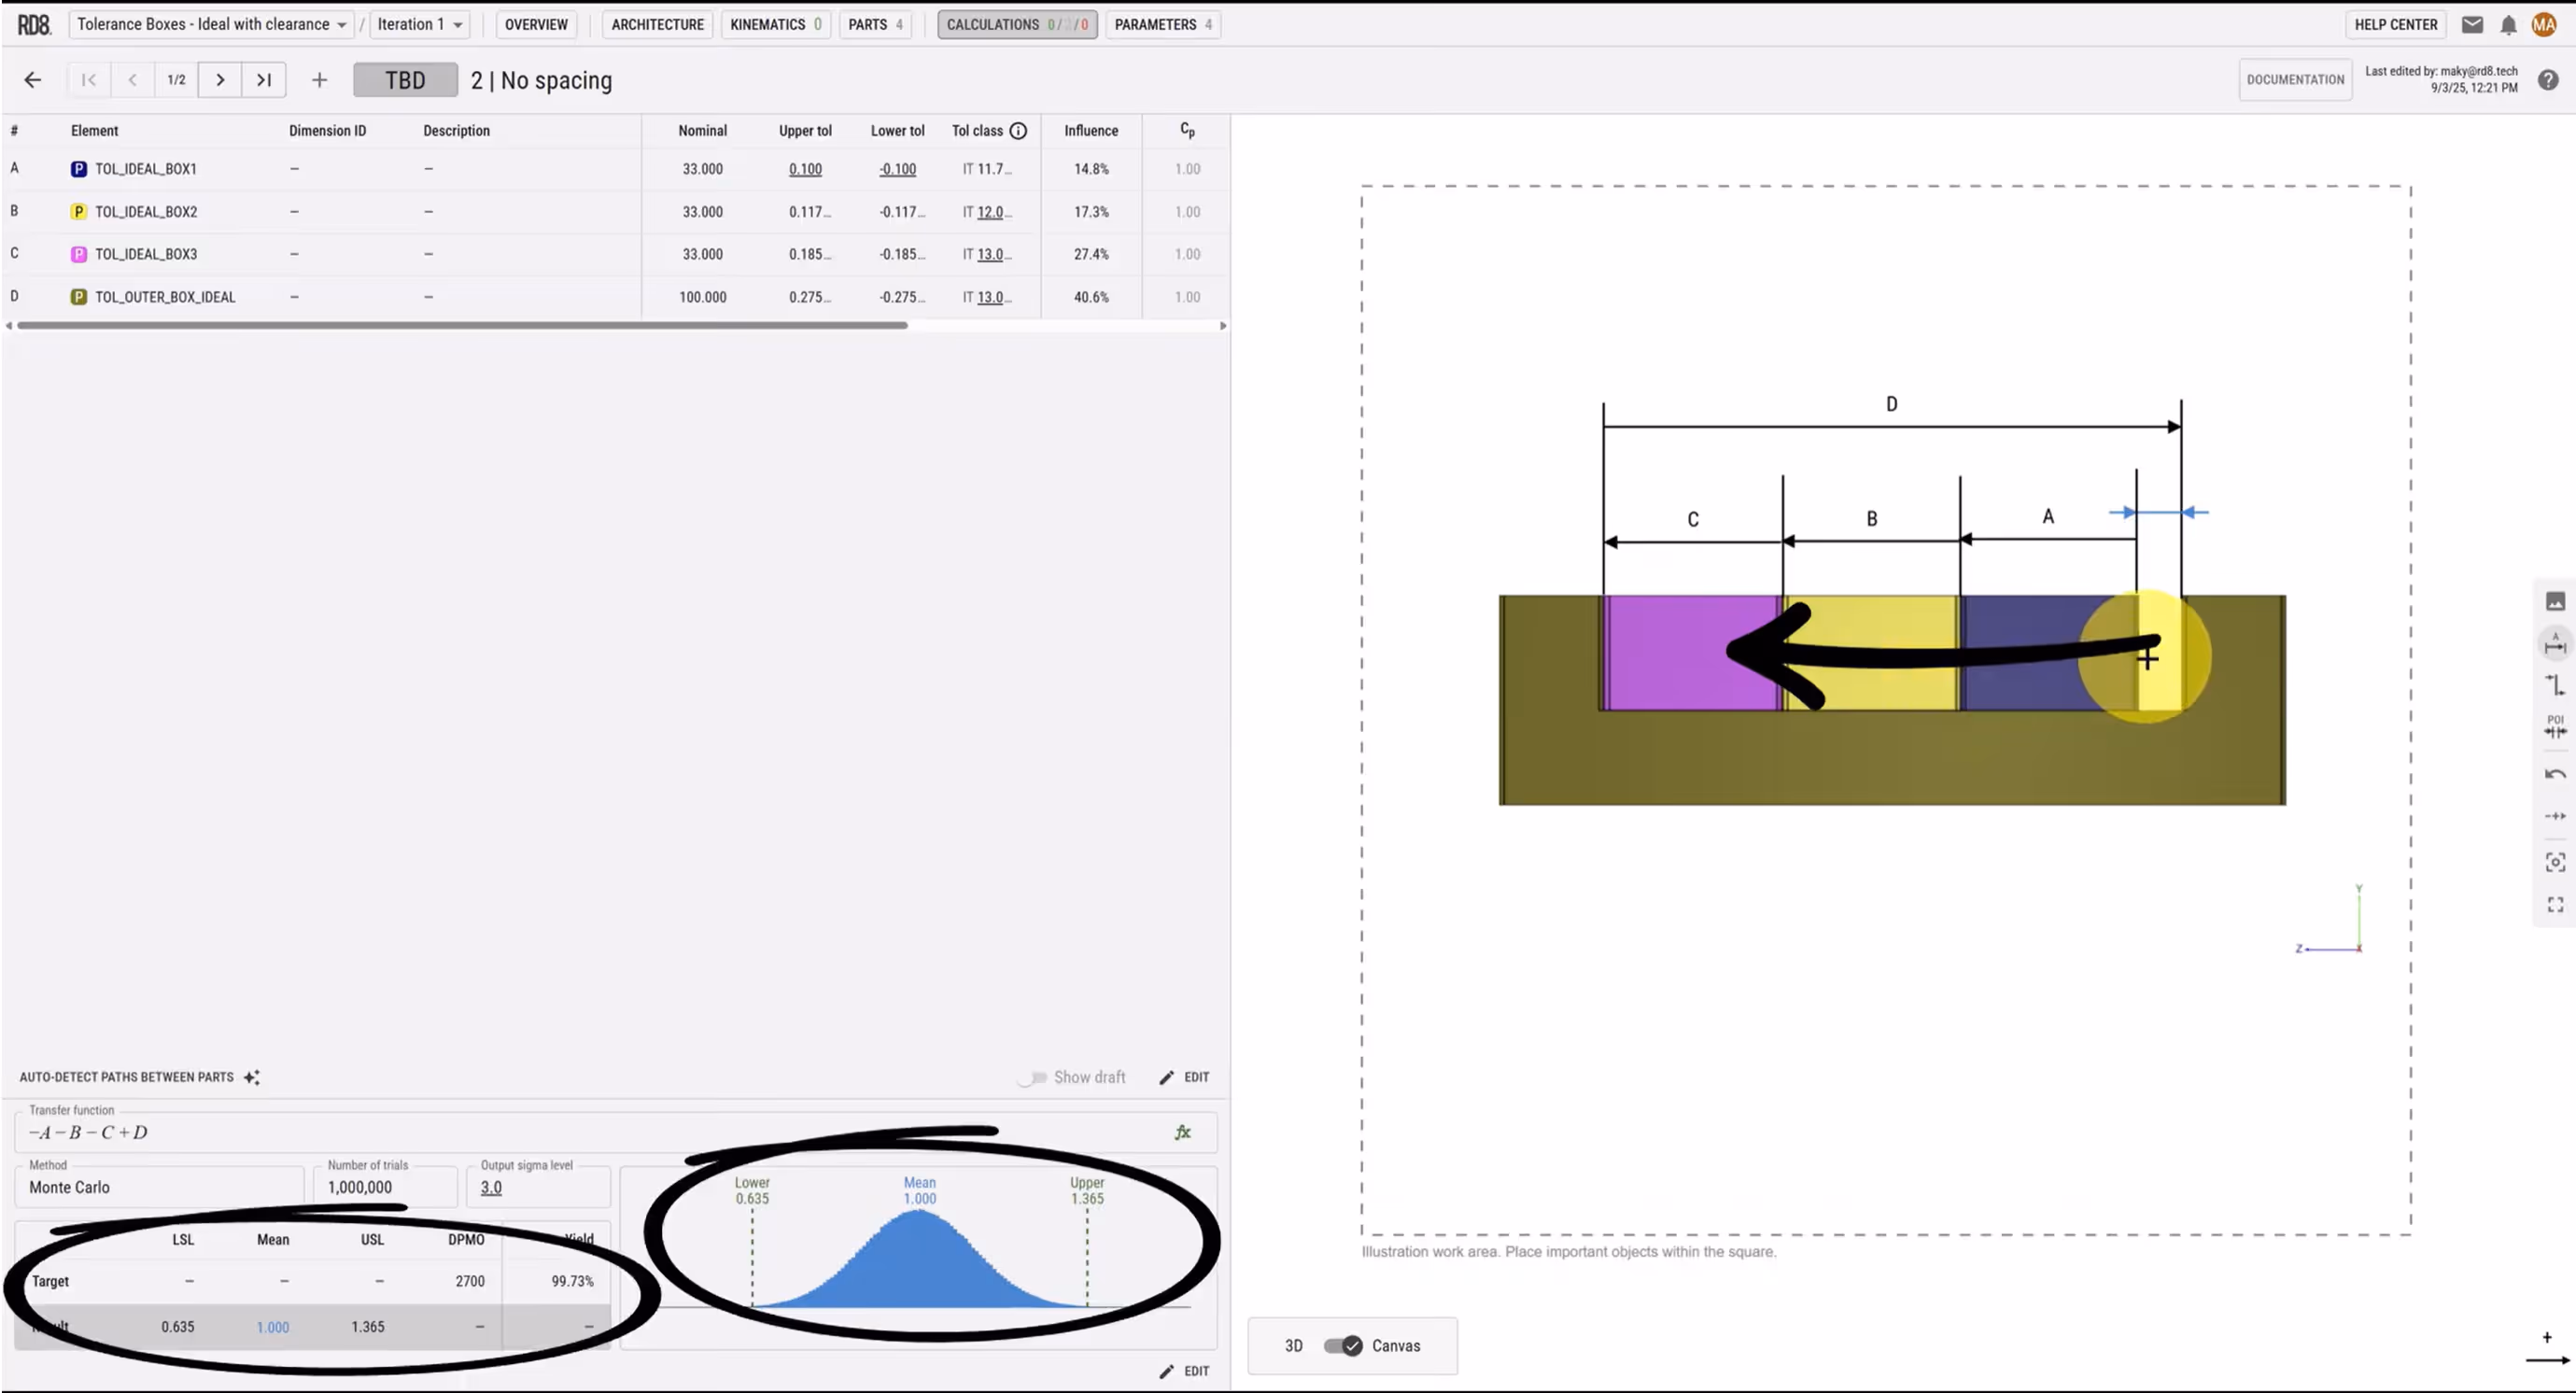
Evaluate if the result is within the acceptable limits.
Also check if the mean matches the mean-target.
If the mean is far from mean-target the process could be more prone to failure when production starts as it is often more likely that the parameter will drift out of its limits due to wear and tear.
Write a conclusion.
Check for sensitive- and high impact parameters. Strive to mitigate these if possible by design.
Check for tight tolerances. Update the design to reduce the need for strict tolerances.
Check if it possible to relax tolerances.
Check and verify the tolerances with 2D documentation and part mesurement reports.
What the Typical Tolerance Analysis Guide Does Not Tell You:
The Basics - Tolerance Stack Up Example
Step 1 introduces you to the fundamentals of tolerance stack-up analysis in a clear, practical way. You’ll learn how to define dimensions, assign tolerances, and assess their combined impact on assembly variation while gaining insight into best practices for robust design. All demonstrated using RD8’s tolerance software.
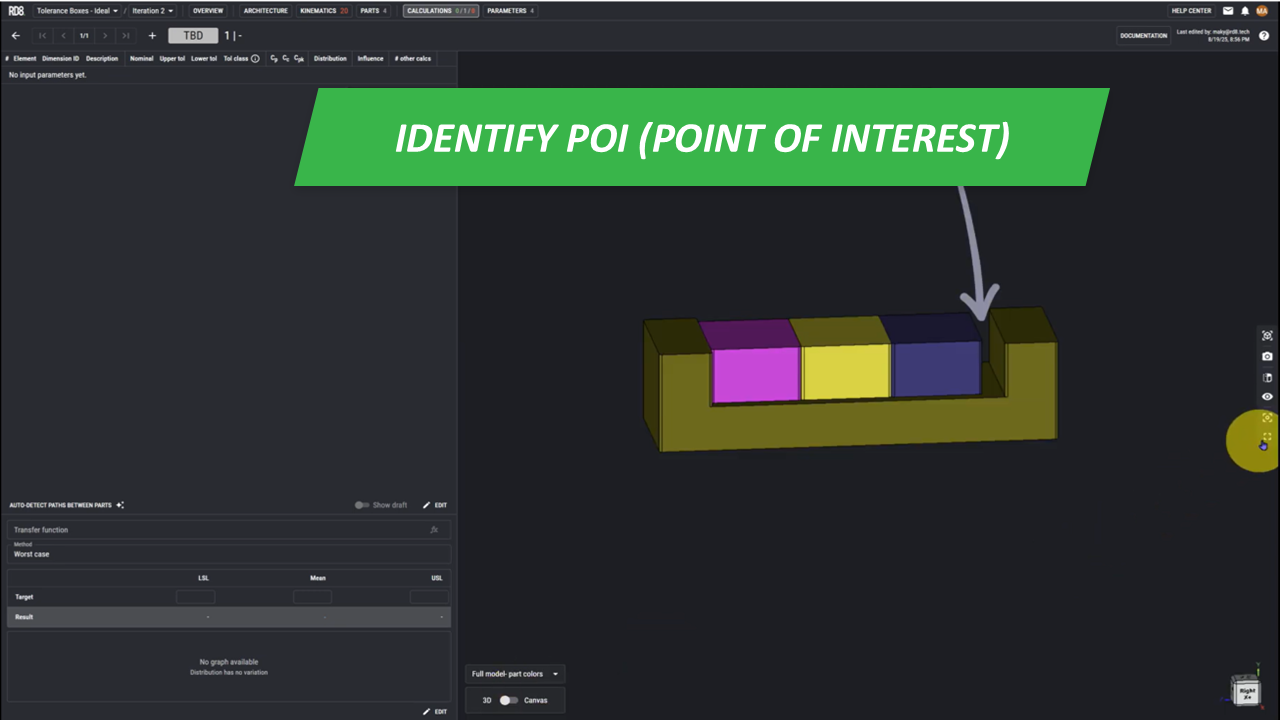
Point 1 - Identify the Point of Interest (POI)
• In this example, the point of interest lies between the cradle, and the third box.

Point 2 - Find Appropriate Views
• Switch to fullscreen mode and position your model as shown in the reference image.
• Take a screenshot of the view.
• Open your empty worksheet, and click once to insert the screenshot.
• Click again to add the corresponding coordinate system.
Point 3 - Identify and Setup the Tolerance Stack
• Position your object so it fits within the dotted square.
• Add help/leader lines.
• Indicate the point of interest(POI) using the blue arrows. It will snap to the helping lines.
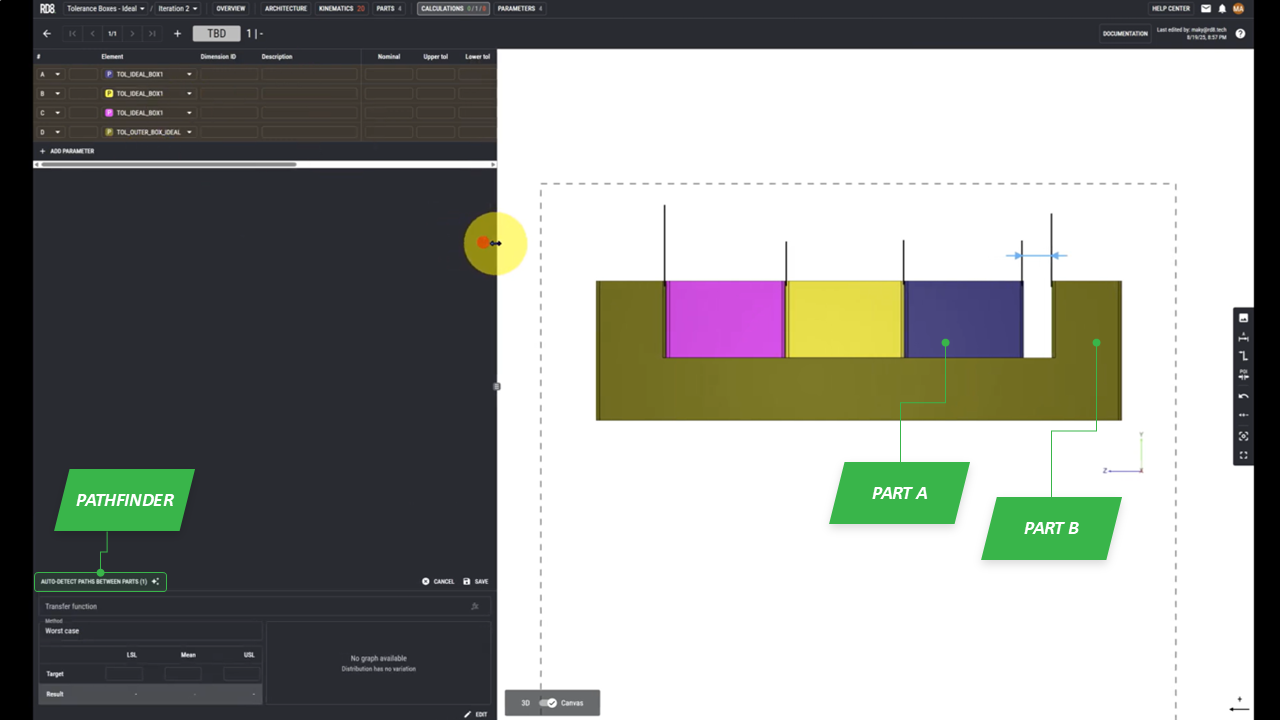
• Use the tolerance path finder to define parameters.
• Select part A and part B corresponding to the POI.
• Select the path that the system found for us.

Point 4 - Make Illustration with Annotations and Link to Annotations to Parameters
• Locate the 'designation arrow' in the menu on the right.
• Assign each arrow to its corresponding parameter

Point 5 - Add Data: Nominal Dimensions and Tolerances
• Enter the values for each parameter.
• Click save to store your inputs.
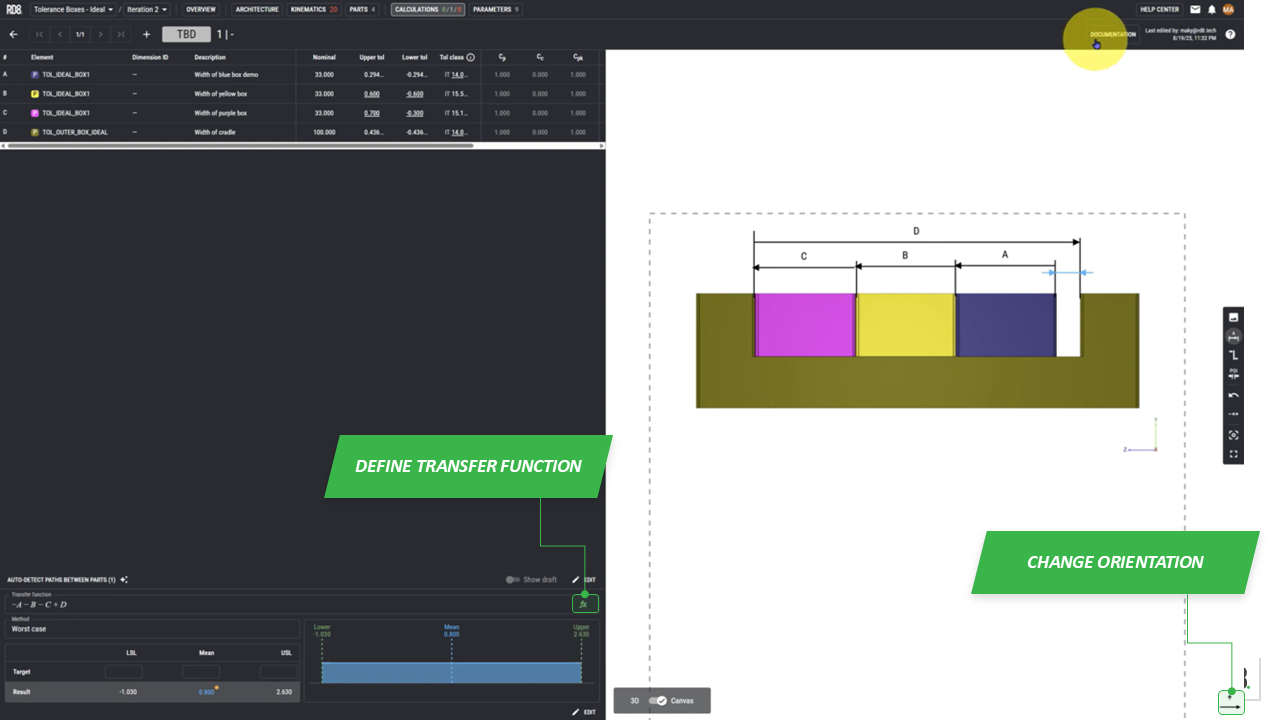
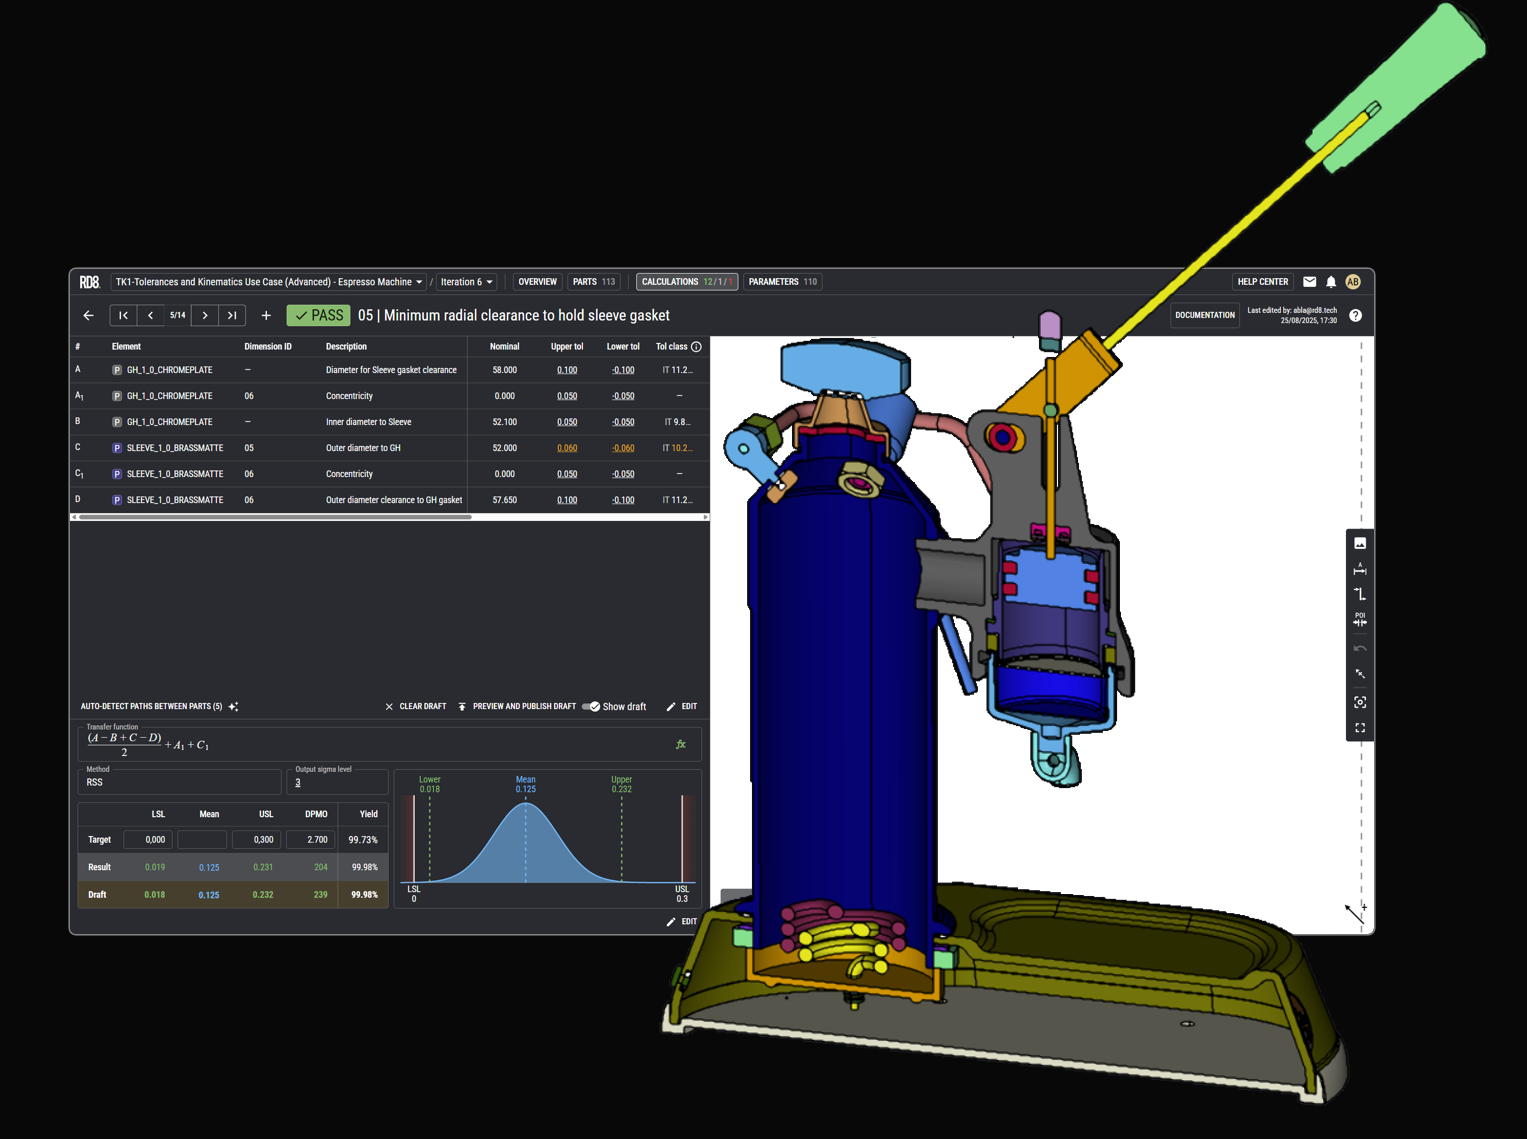
Part 6 - Define the Transfer Function
• Define the transfer function as shown in the reference image.
• For 1D stacks - the transfer function can be derived automatically.
• Define the positive direction of the analysis.
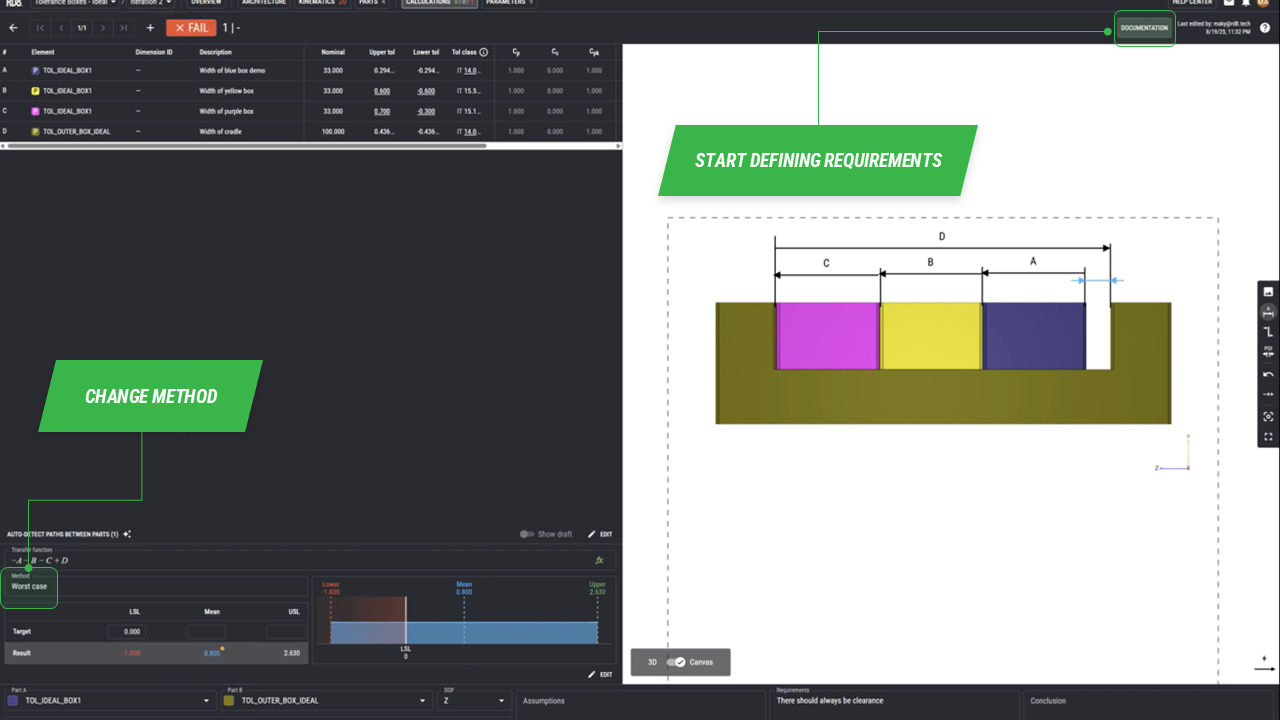
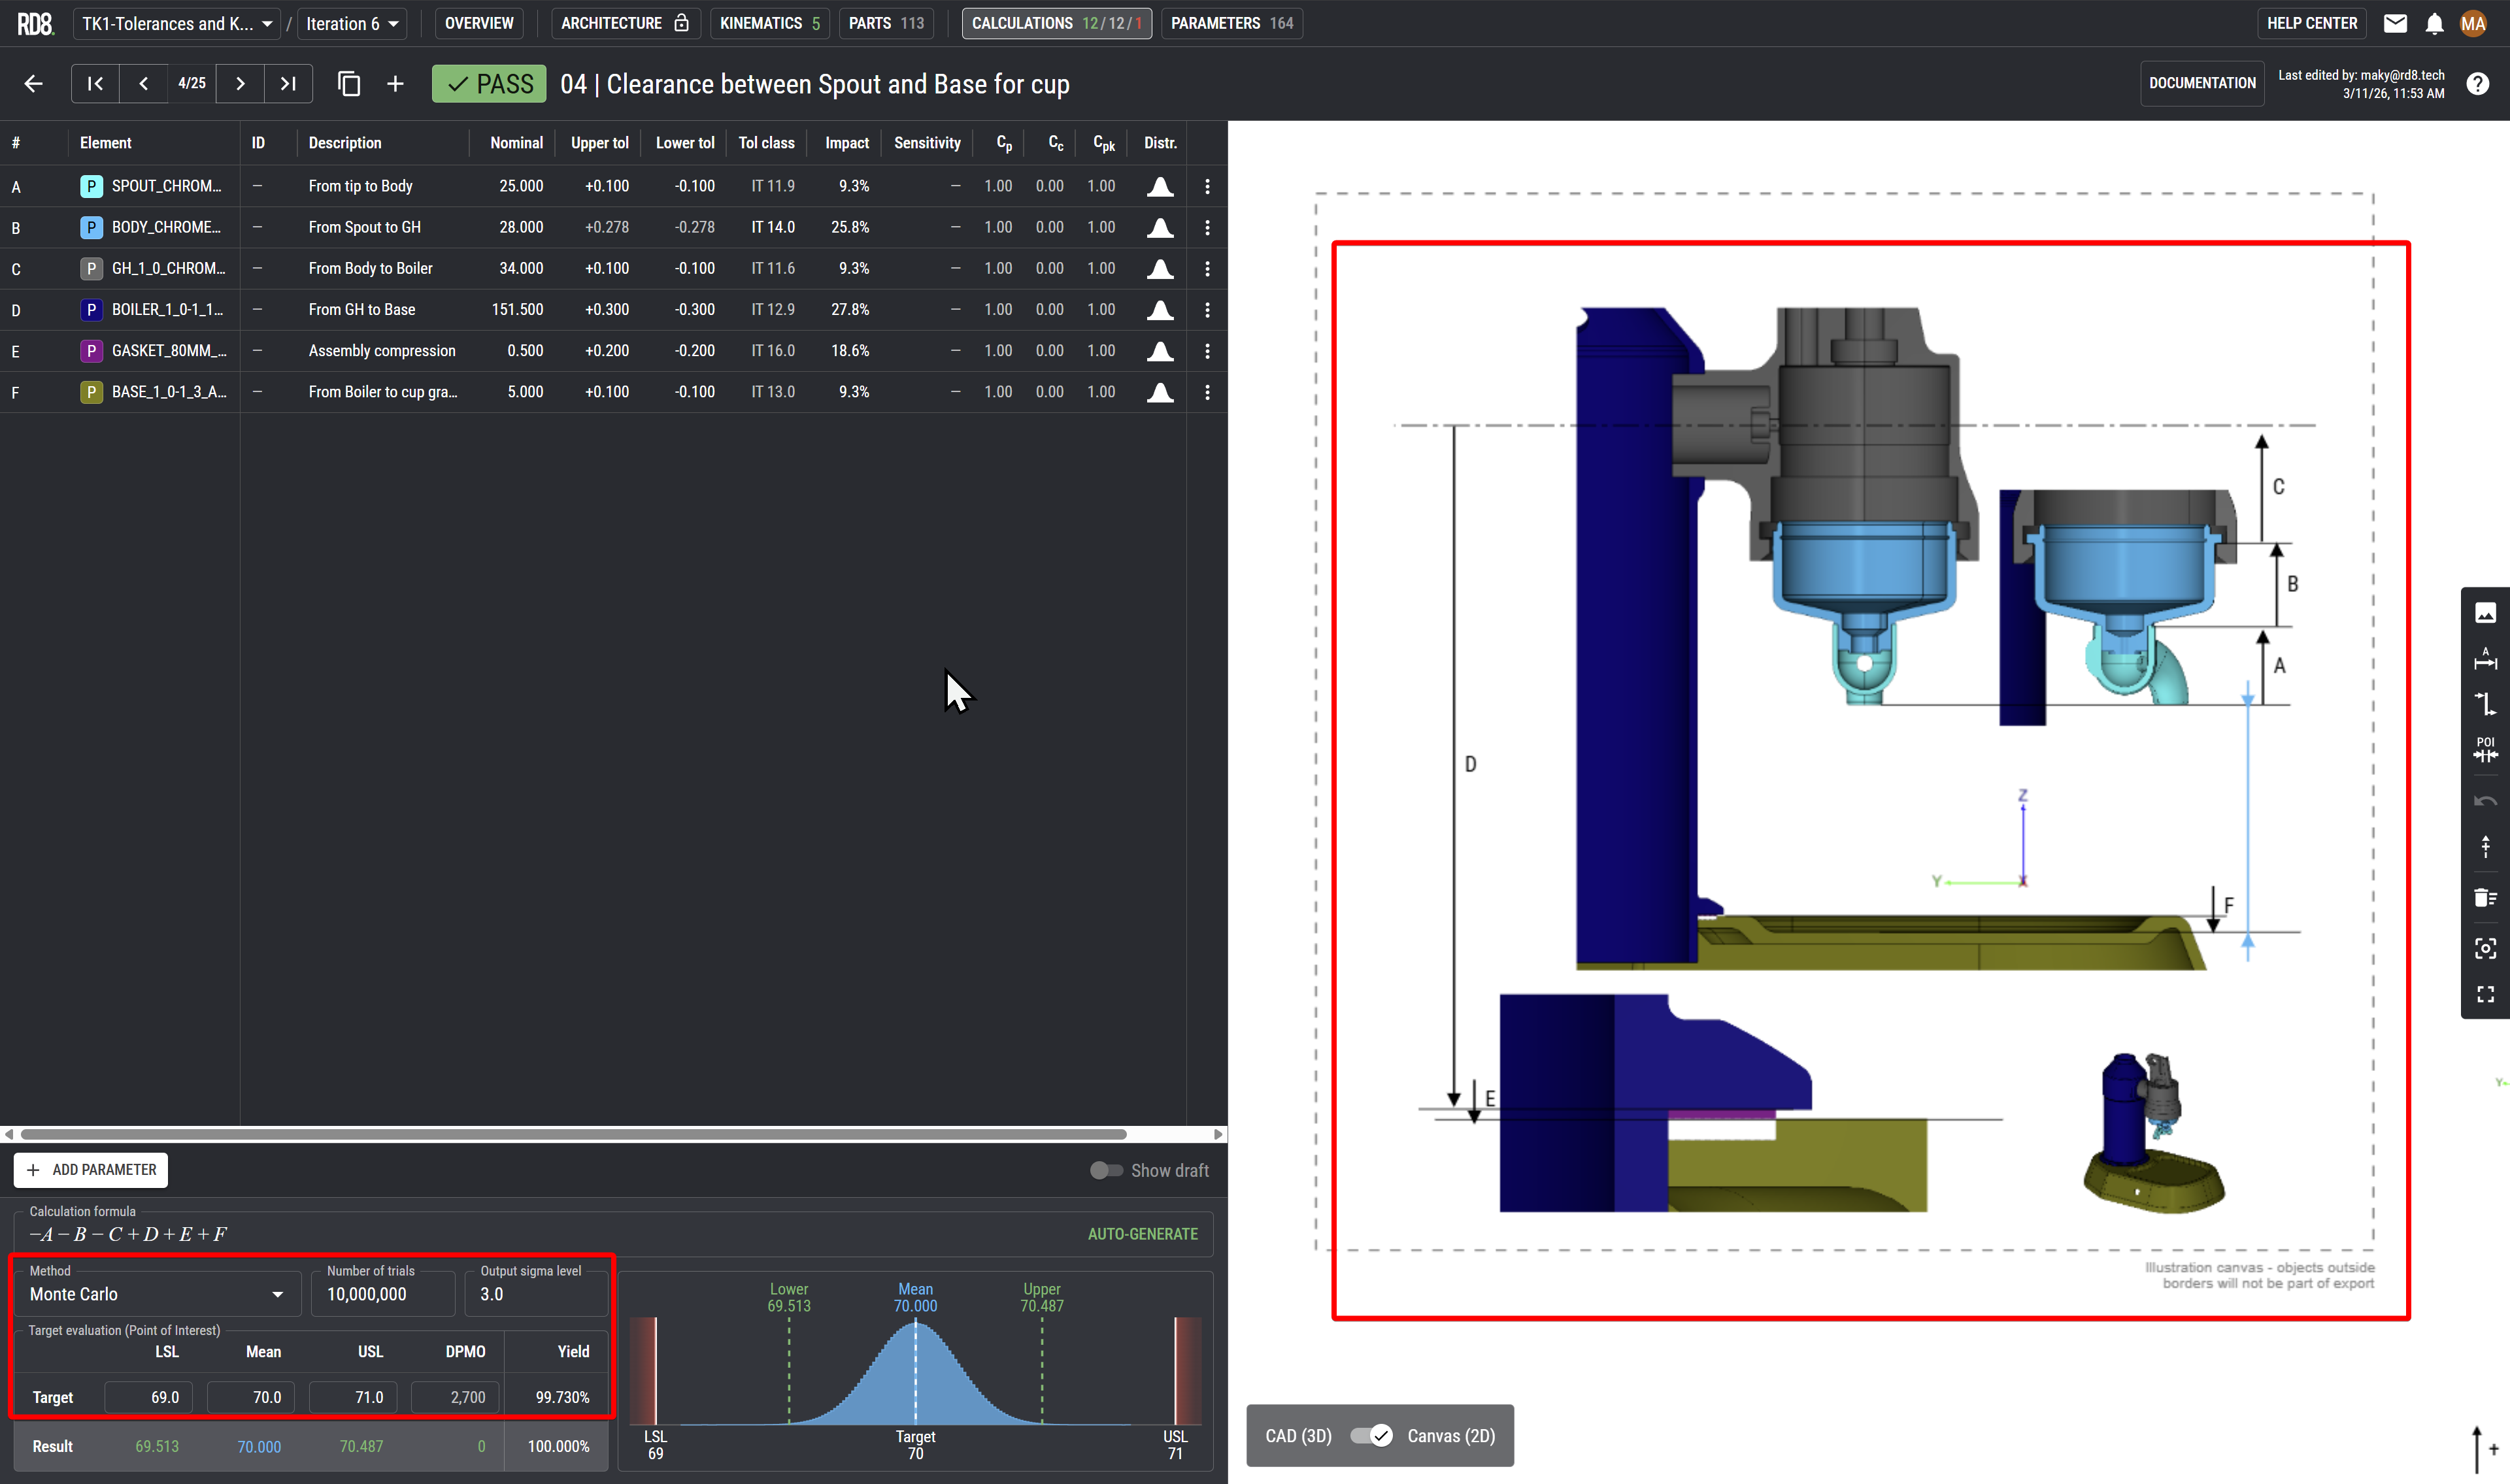
Point 7 - Define Requirements and Set Targets
• Open the menu to define your requirements in the top right corner.
• In this example we say "there should always be clearance" which corresponds to setting LSL target to 0.00.
•Click save to make the program calculate based on your chosen settings.
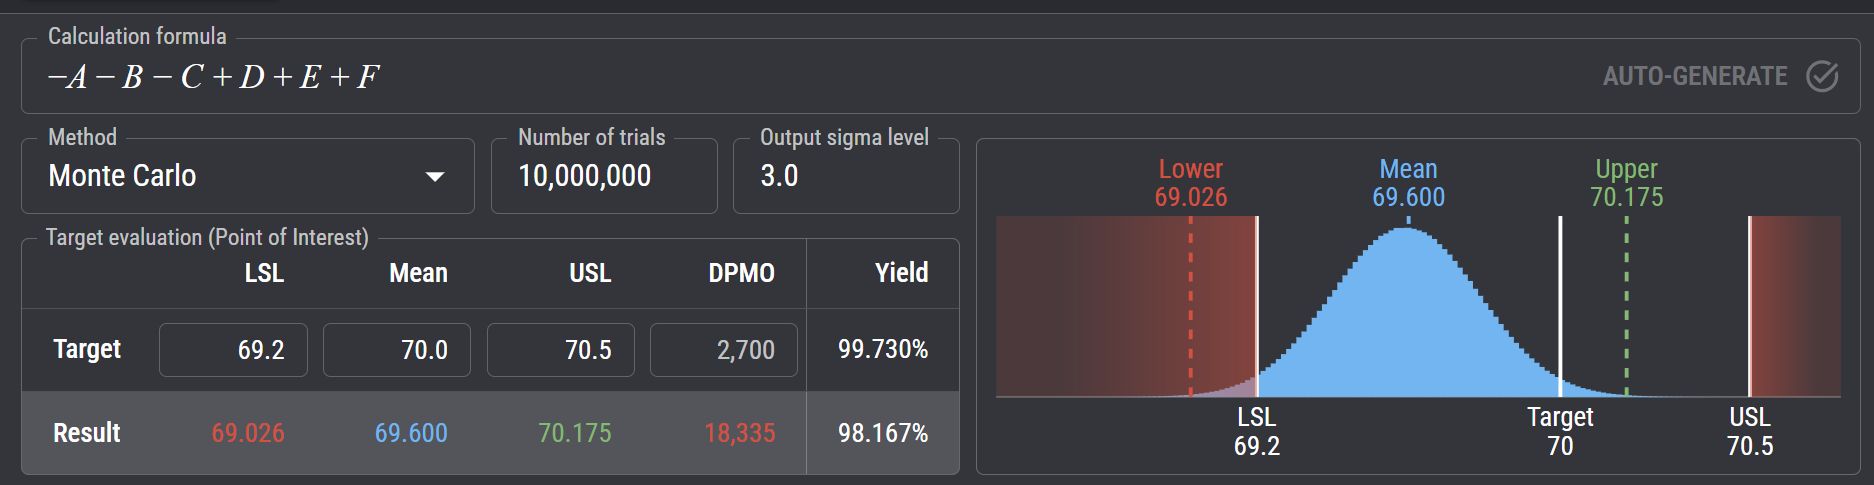
•Change the evaluation method under the "Method" tab.
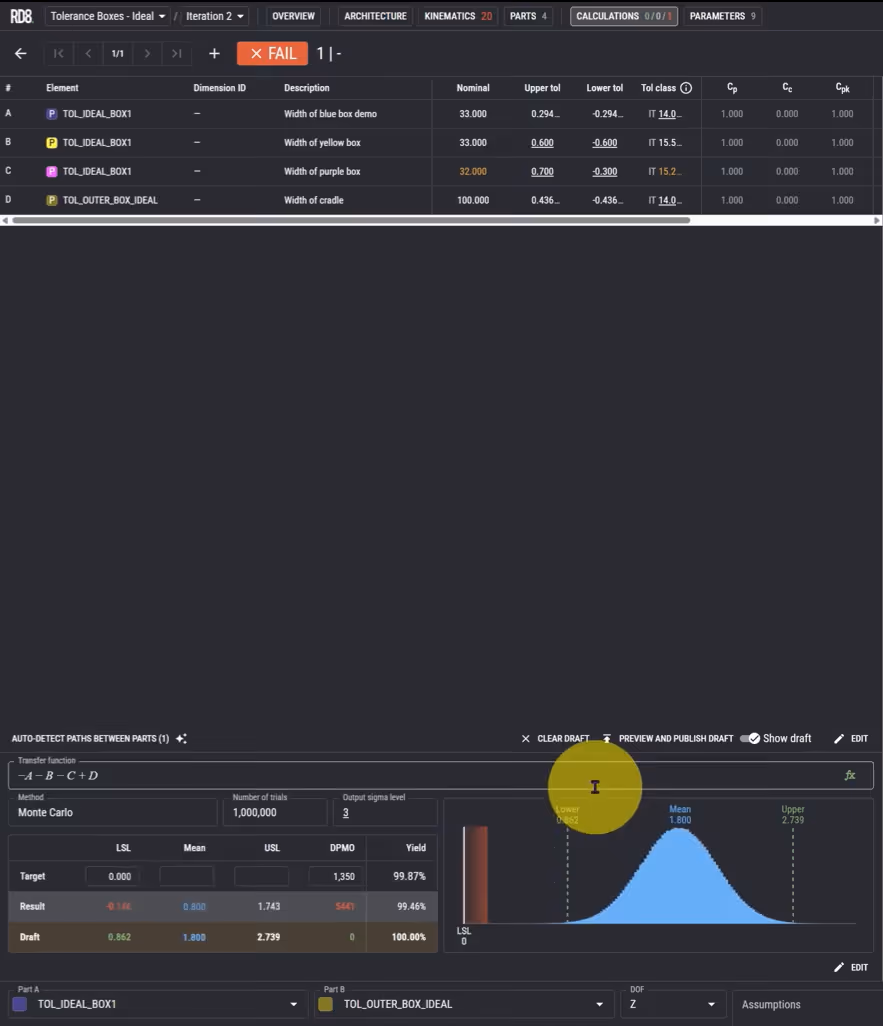
Point 8 - Optimize or Adjust
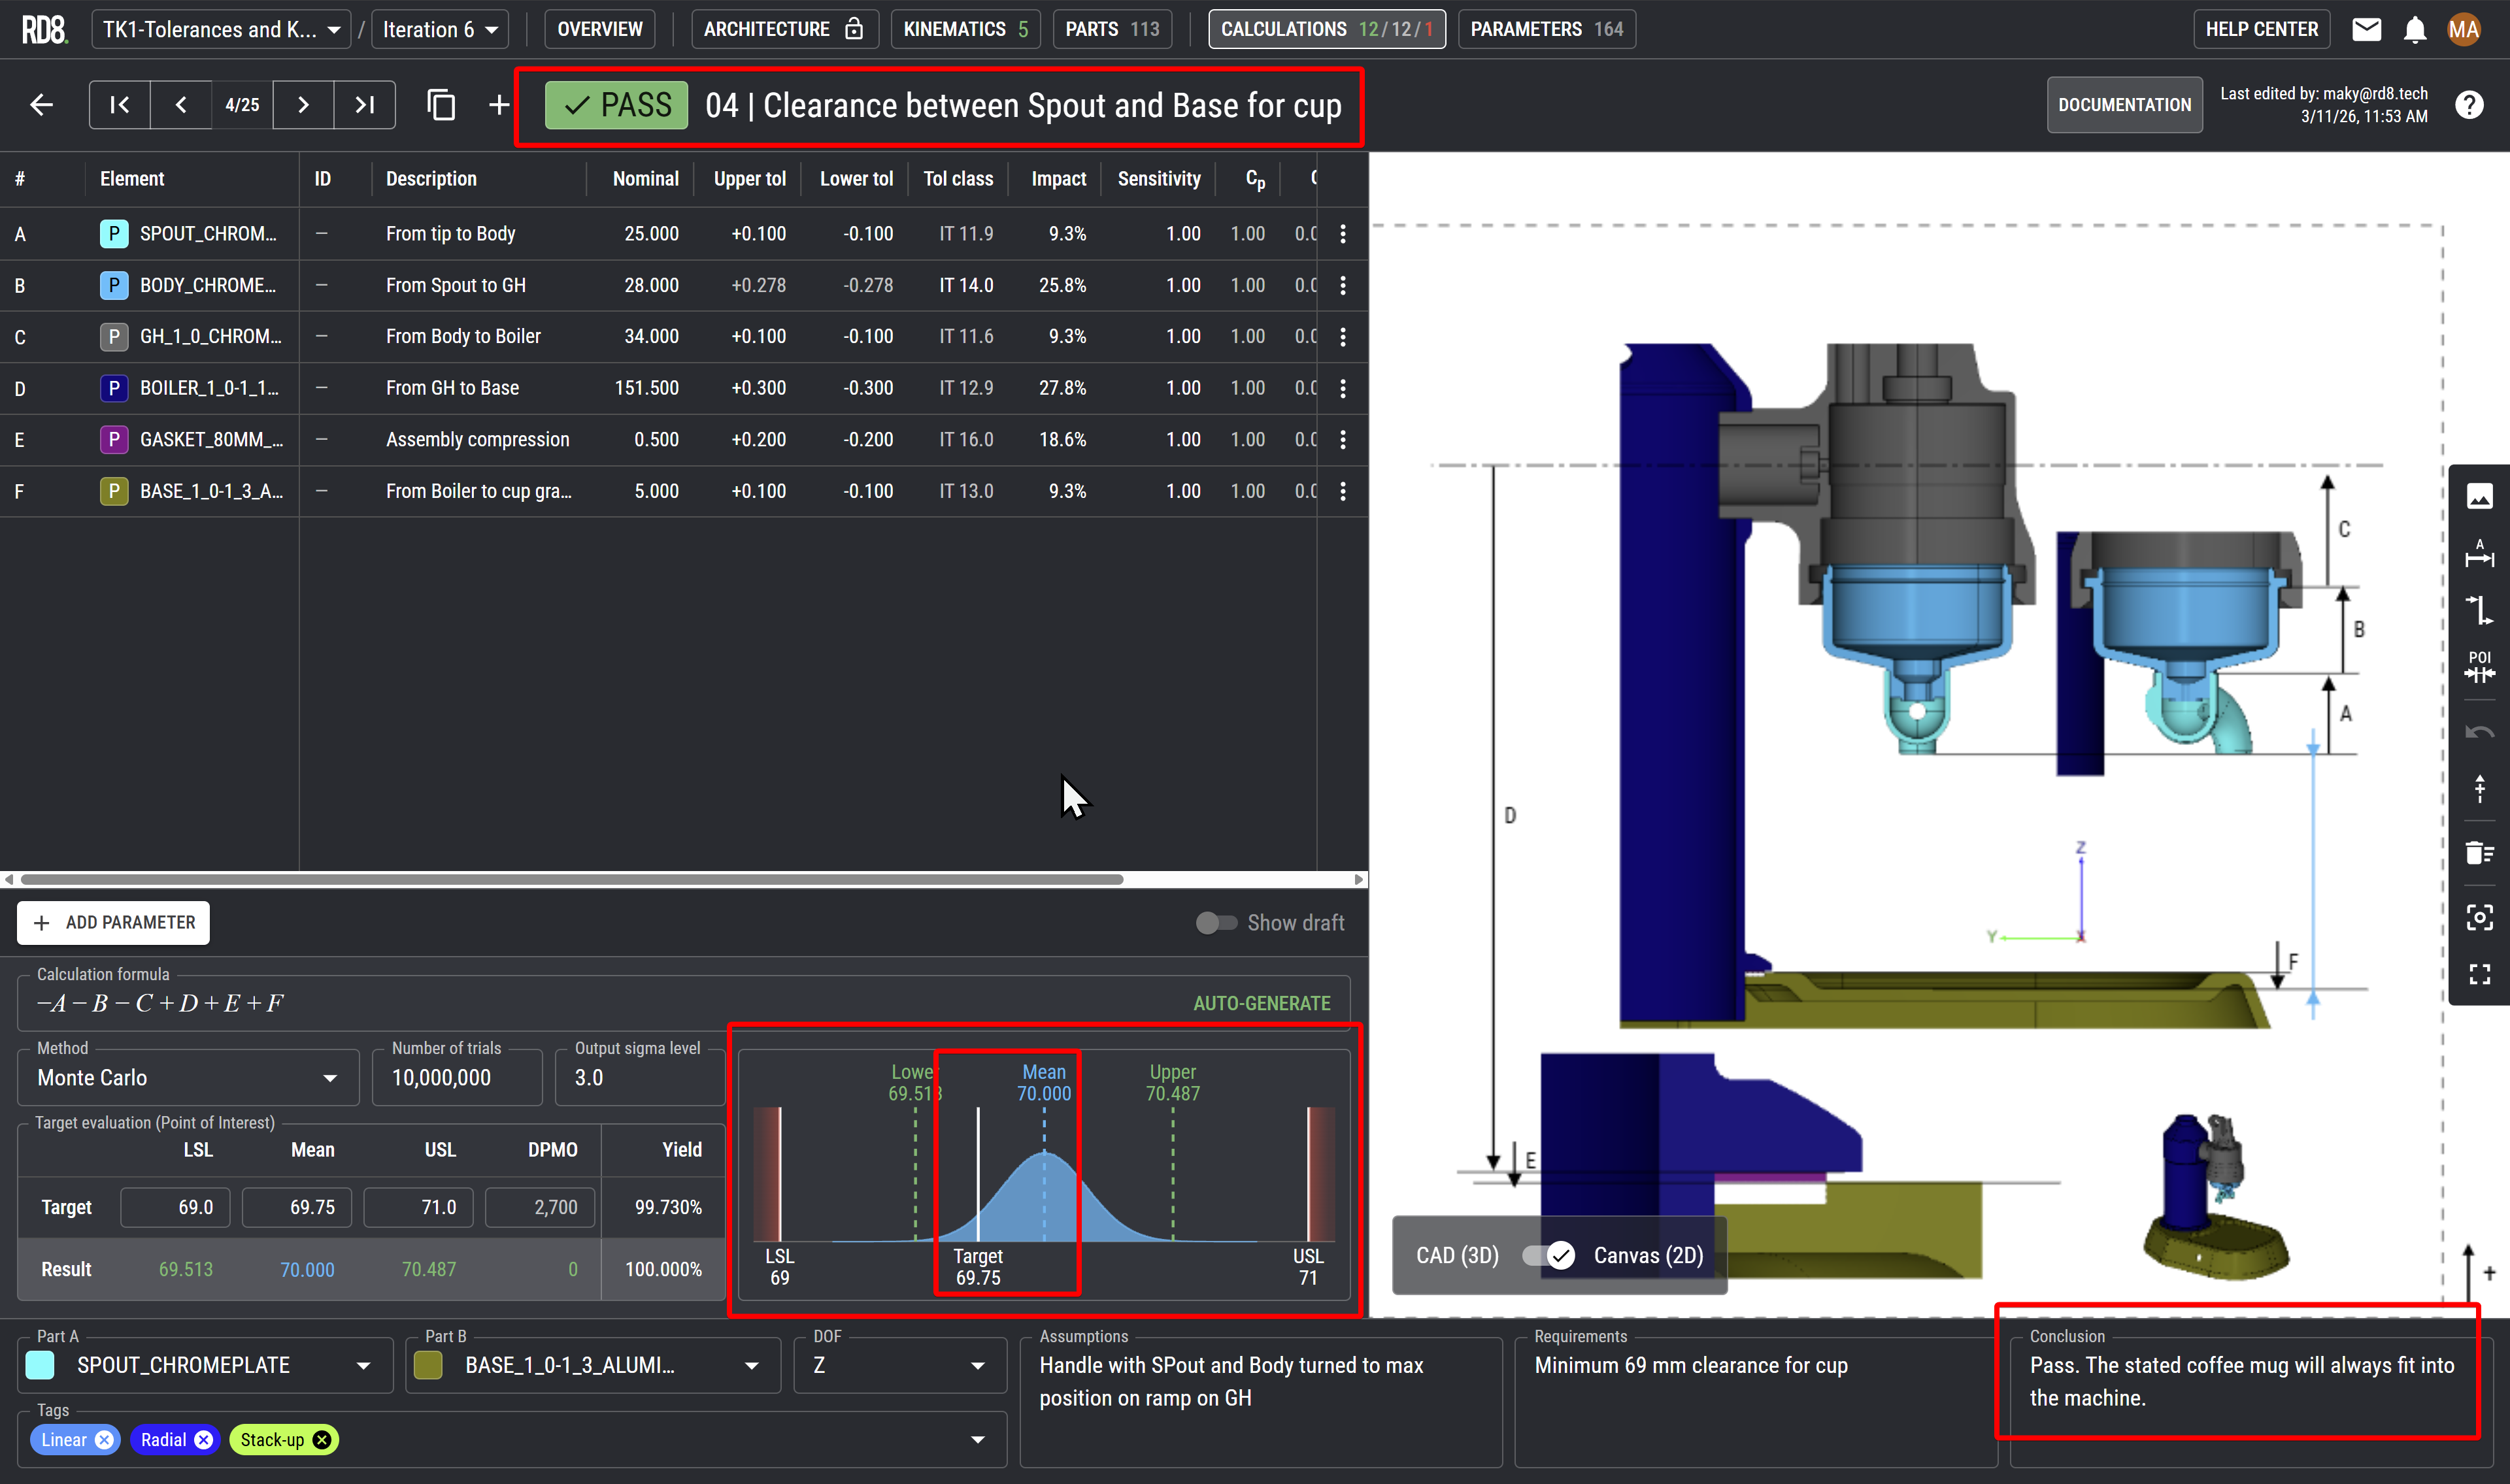
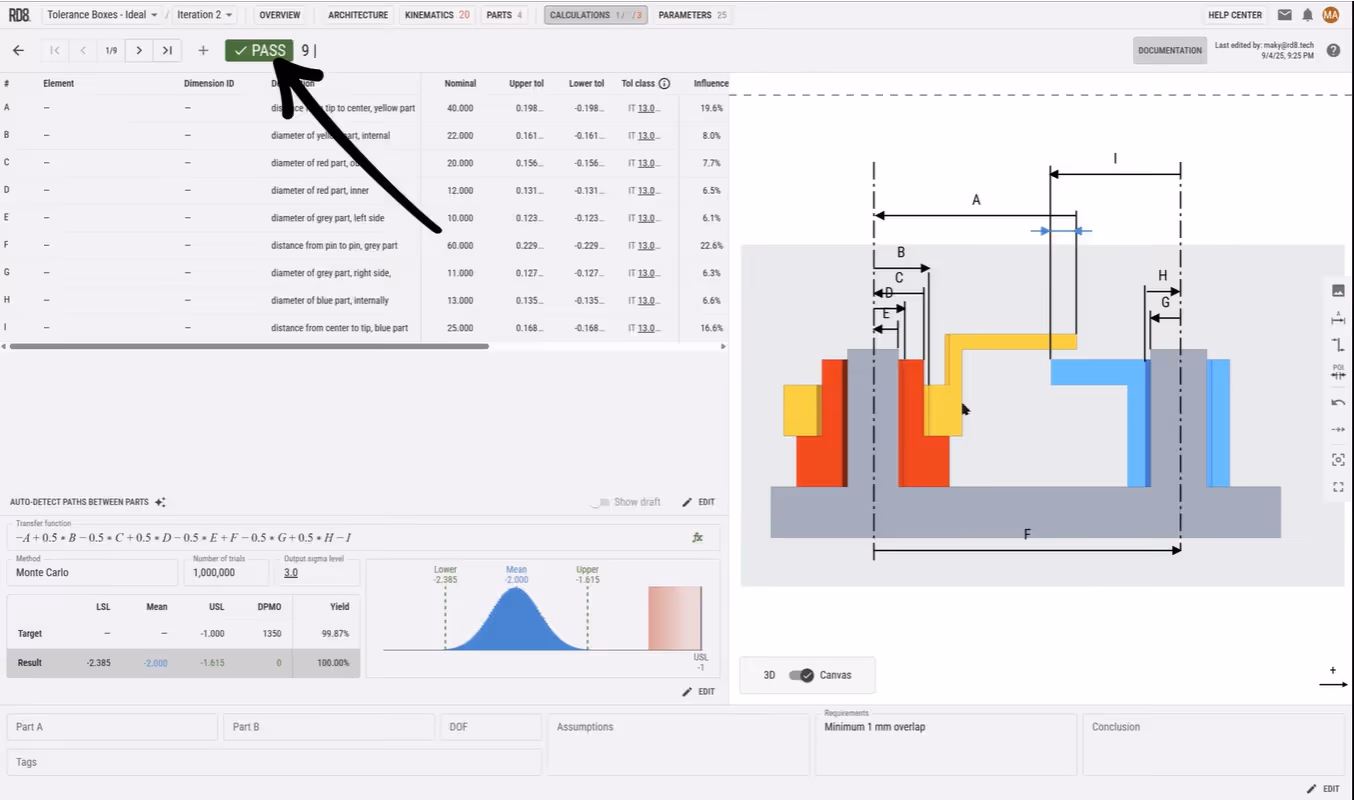
• Using Monte Carlo simulations, this example resulted in a succesfull scenario 99.46% of the time.
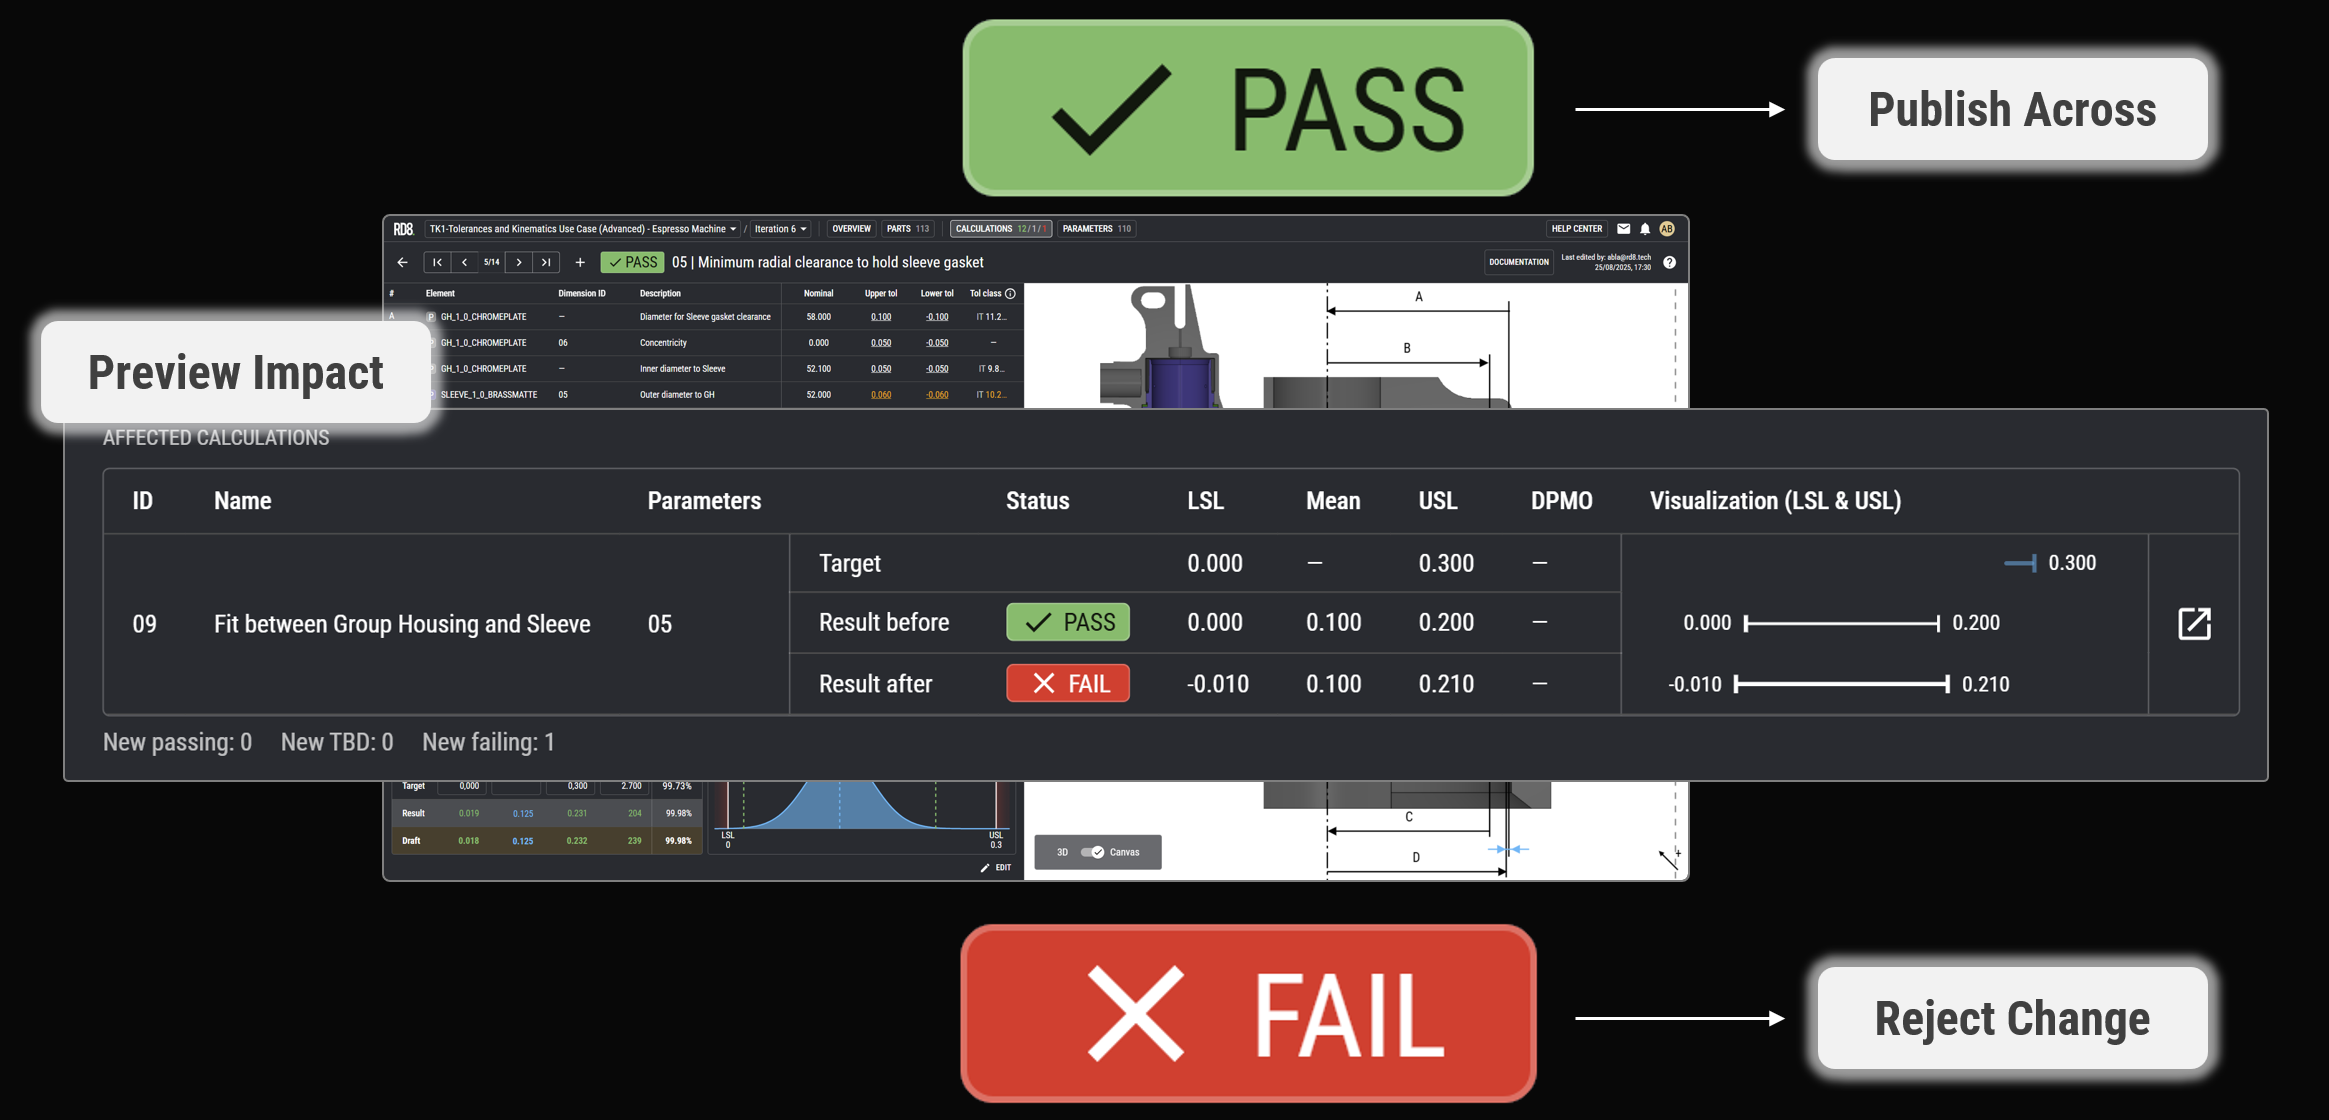
• We can now modify the parameter values and click save again. This will generate a new draft, with updated values, allowing you to compare them with previous ones.
•Click "PREVIEW AND PUBLISH DRAFT" to finalize and apply the changes.
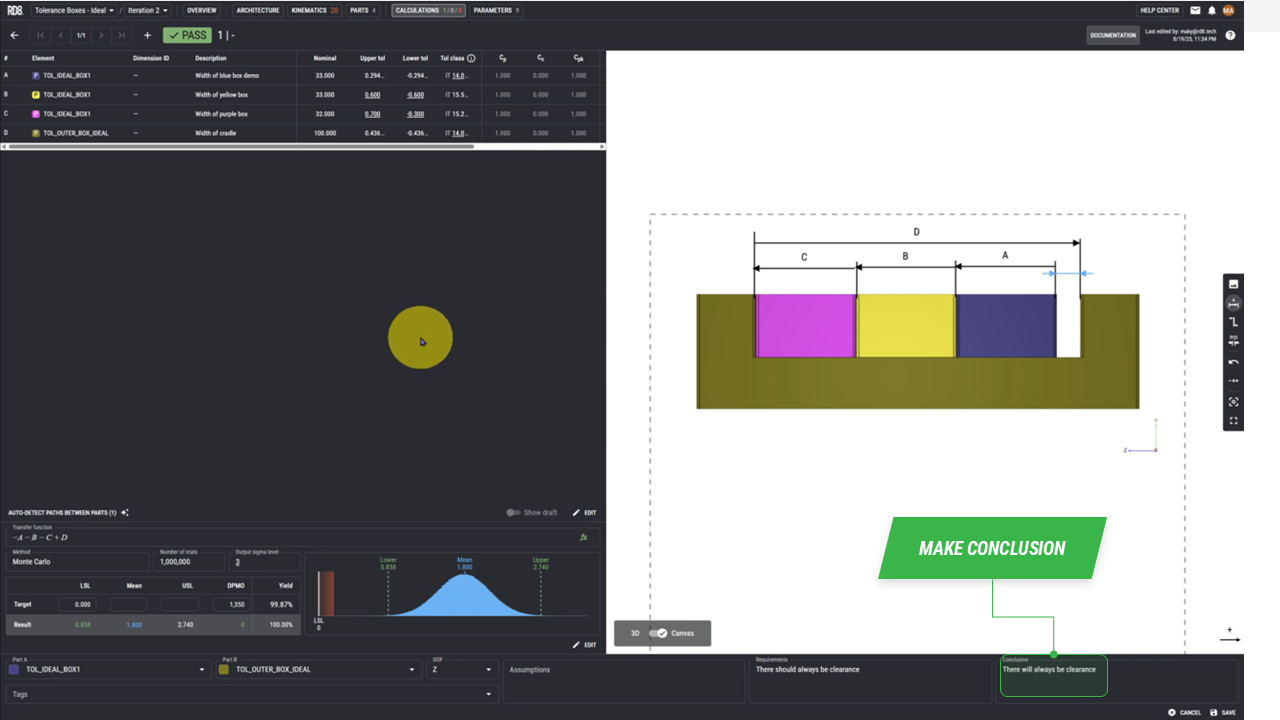
Point 9 - Make a Conclusion
• After adjusting the parameters, the design now ensures that clearance is always maintained.
• Now we write in the conclusion: "There will always be clearance"
How To Handle Clearances
In this guide, we will explore practical examples of handling clearances during tolerance stack-up analysis. First, we will cover a simple, generalized approach to managing clearances. Then, we will dive into a more specific scenario involving pin-joints.
Basic Example of Clearances and Best Practice
• Set up your tolerance stack as usual when working with clearances.
• For every clearance, add a help/leader-line on each side.
• This helps to clarify interface boundaries.
• Imagine that in a worst case scenario - all the boxes are pushed to the left. Setting up a tolerance stack in neutral position and in a worst case position yields the same results.

Handling Stack-Up with Pin-Joints
• When performing tolerance stack-up analysis with pin-joints, best practice is to place the pin-joint in a neutral position
• Alternatively, pin joints can be pushed to their worst case position to make illustrations simpler.
Advanced Tolerance Stack Example: Part 1
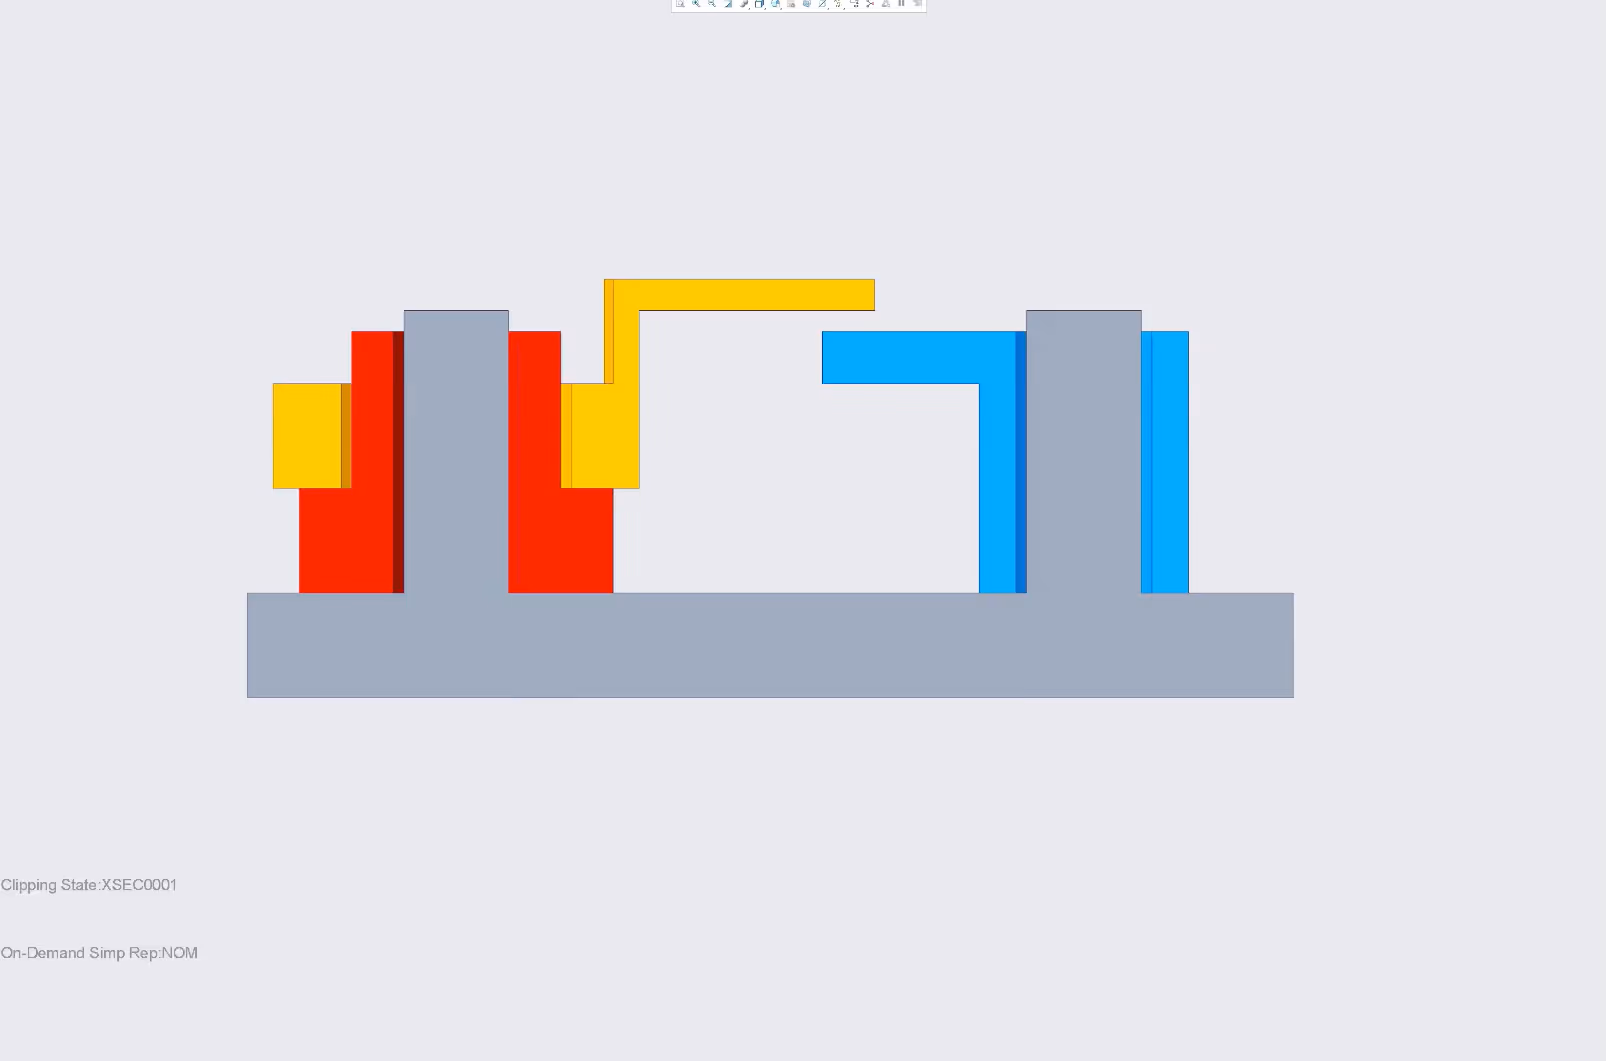
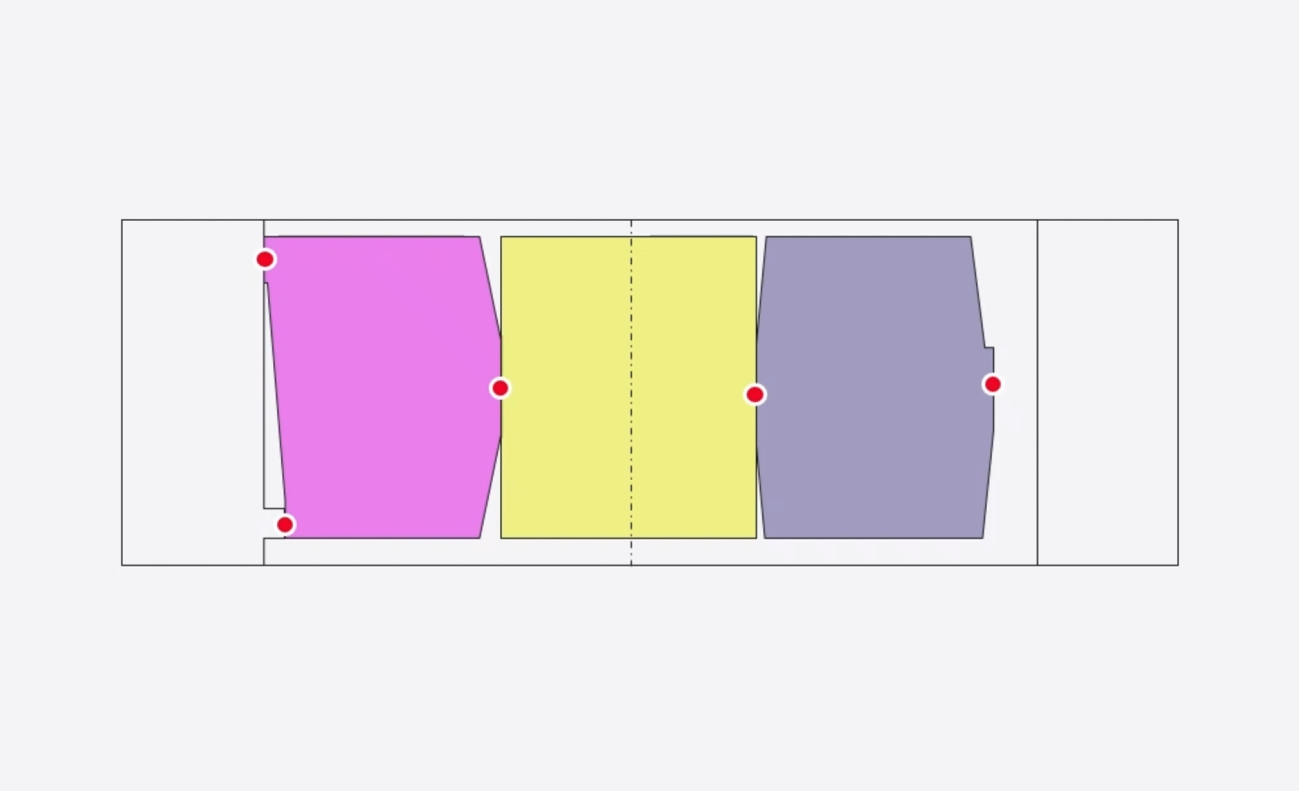
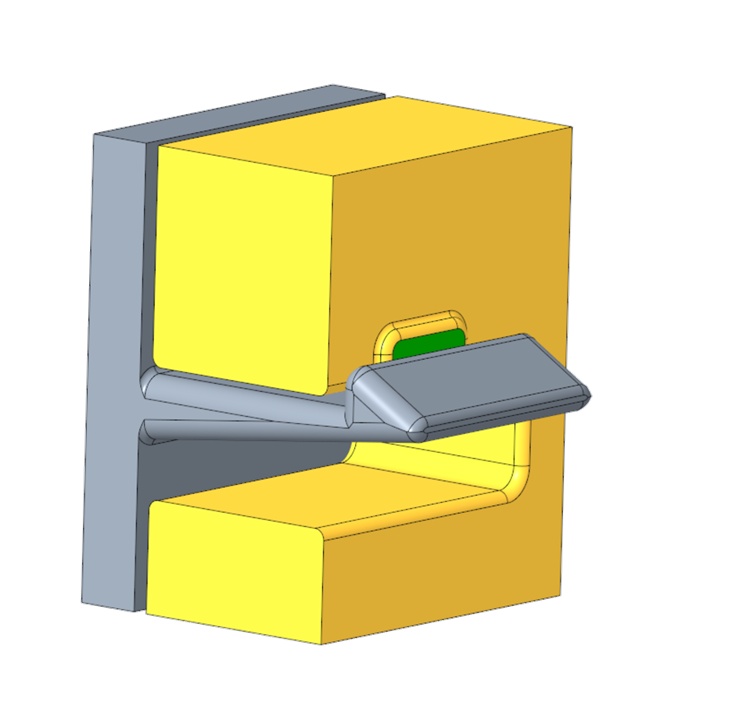
In this example, the purpose is to evaluate if there will be at least 1 mm overlap between the yellow arm and the blue arm (always).
• The image shows is a cross section - a good fit for an illustration.
• In this case the assembly is setup with clearances (it's neutral position).
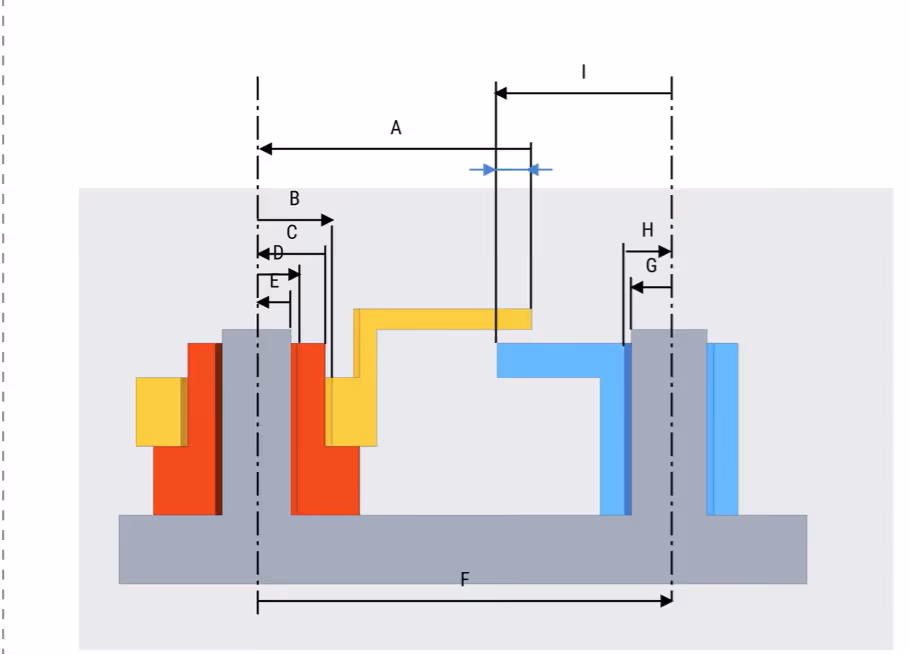
Advanced Tolerance Stack Example: Part 2
• Set up help/leader-lines and mark the "Point of Interest"
• Place a help/leader-lines on each side of every clearance
• Now setup parameter arrows, they should follow the alternating pattern shown in the image.
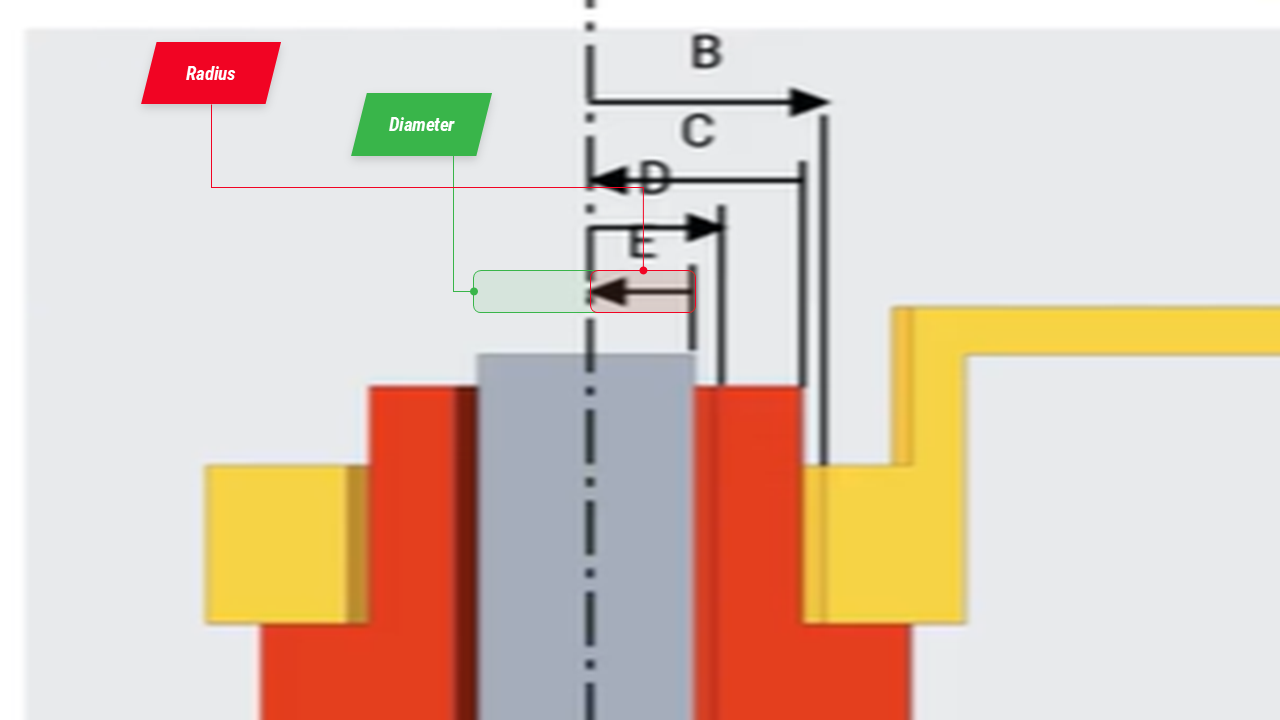
Advanced Tolerance Stack Example: Part 3
• Add parameter values as diameters, not radii.
• Diameters are converted to radiis when defining the transfer function
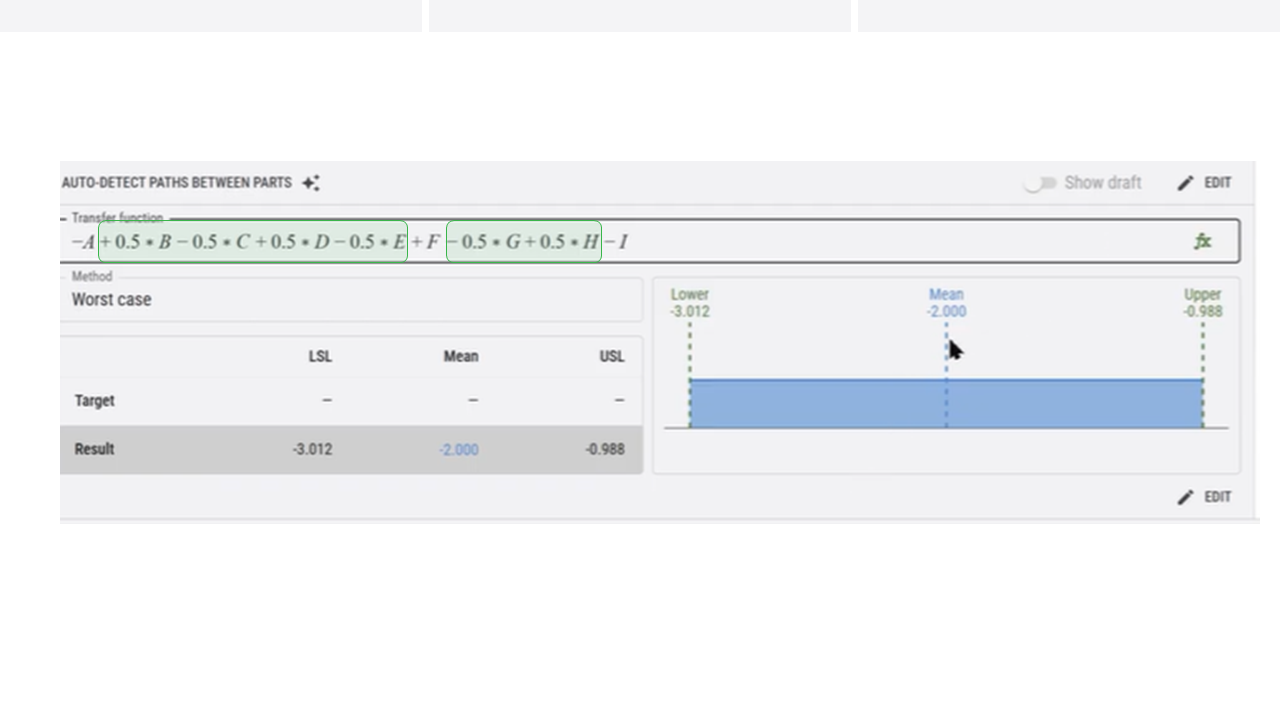
Advanced Tolerance Stack Example: Part 4
• When defining the transfer function, manually convert diameter values that should be radii by multiplying them by 0.5 (or by dividing by 2)
• Add your requirements (Targets for USL, Mean, USL) and run the simulation.
Advanced Tolerance Stack Example: Final Result
• Choose evaluation method: Worst Case, RSS, Statistical or Monte Carlo.
• The final result now shows as passed, which means that our design passes the given requirements.
Finding Your Tolerance Stack Path
Step 3 shows you how to set up and identify a tolerance stack. And more important - to spot if a design is ready for tolerance analysis - if there is a clear tolerance stack path or if it is ambigious.

How Would you Define the Tolerance Stack in this Example?
• When analyzing your mechanical design, it can be challenging to identify the correct path.
• The example - is by intent: simple and tricky. There is no clear path!
Unclear Paths = You Cannot Trust The Stack-Up Calculation
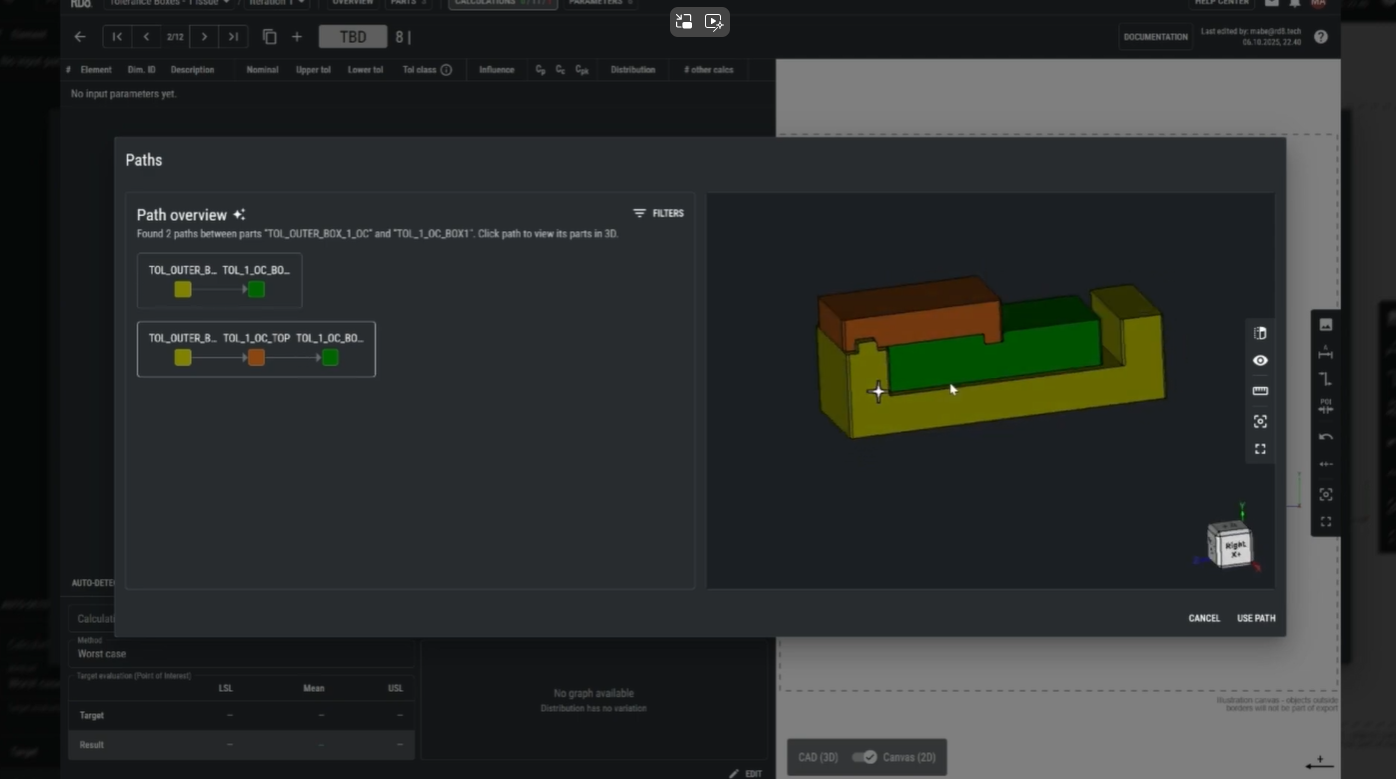
• In this example, there are two possible paths
• Using RD8's Pathfinder tool will display these two paths
• If one is calculated - there is a chance that the other will be the governing. You are not in control. The design is overconstrained and hence itis impossible to make a prober tolerance stack.
Which Tolerance Stack Path Should you Chose?
• This creates a risk of conflicting paths - sometimes one path controls, other times the second does.
• Such uncertainty adds no value to the product and can lead to design issues - and certianly adds to lost control and unpredictability.
How To Fix Your Tolerance Stack
• An the shown example - two different paths exist.
• This happens because the design is overconstrained.
• The RD8 X-ray feature helps to identify overconstraints.
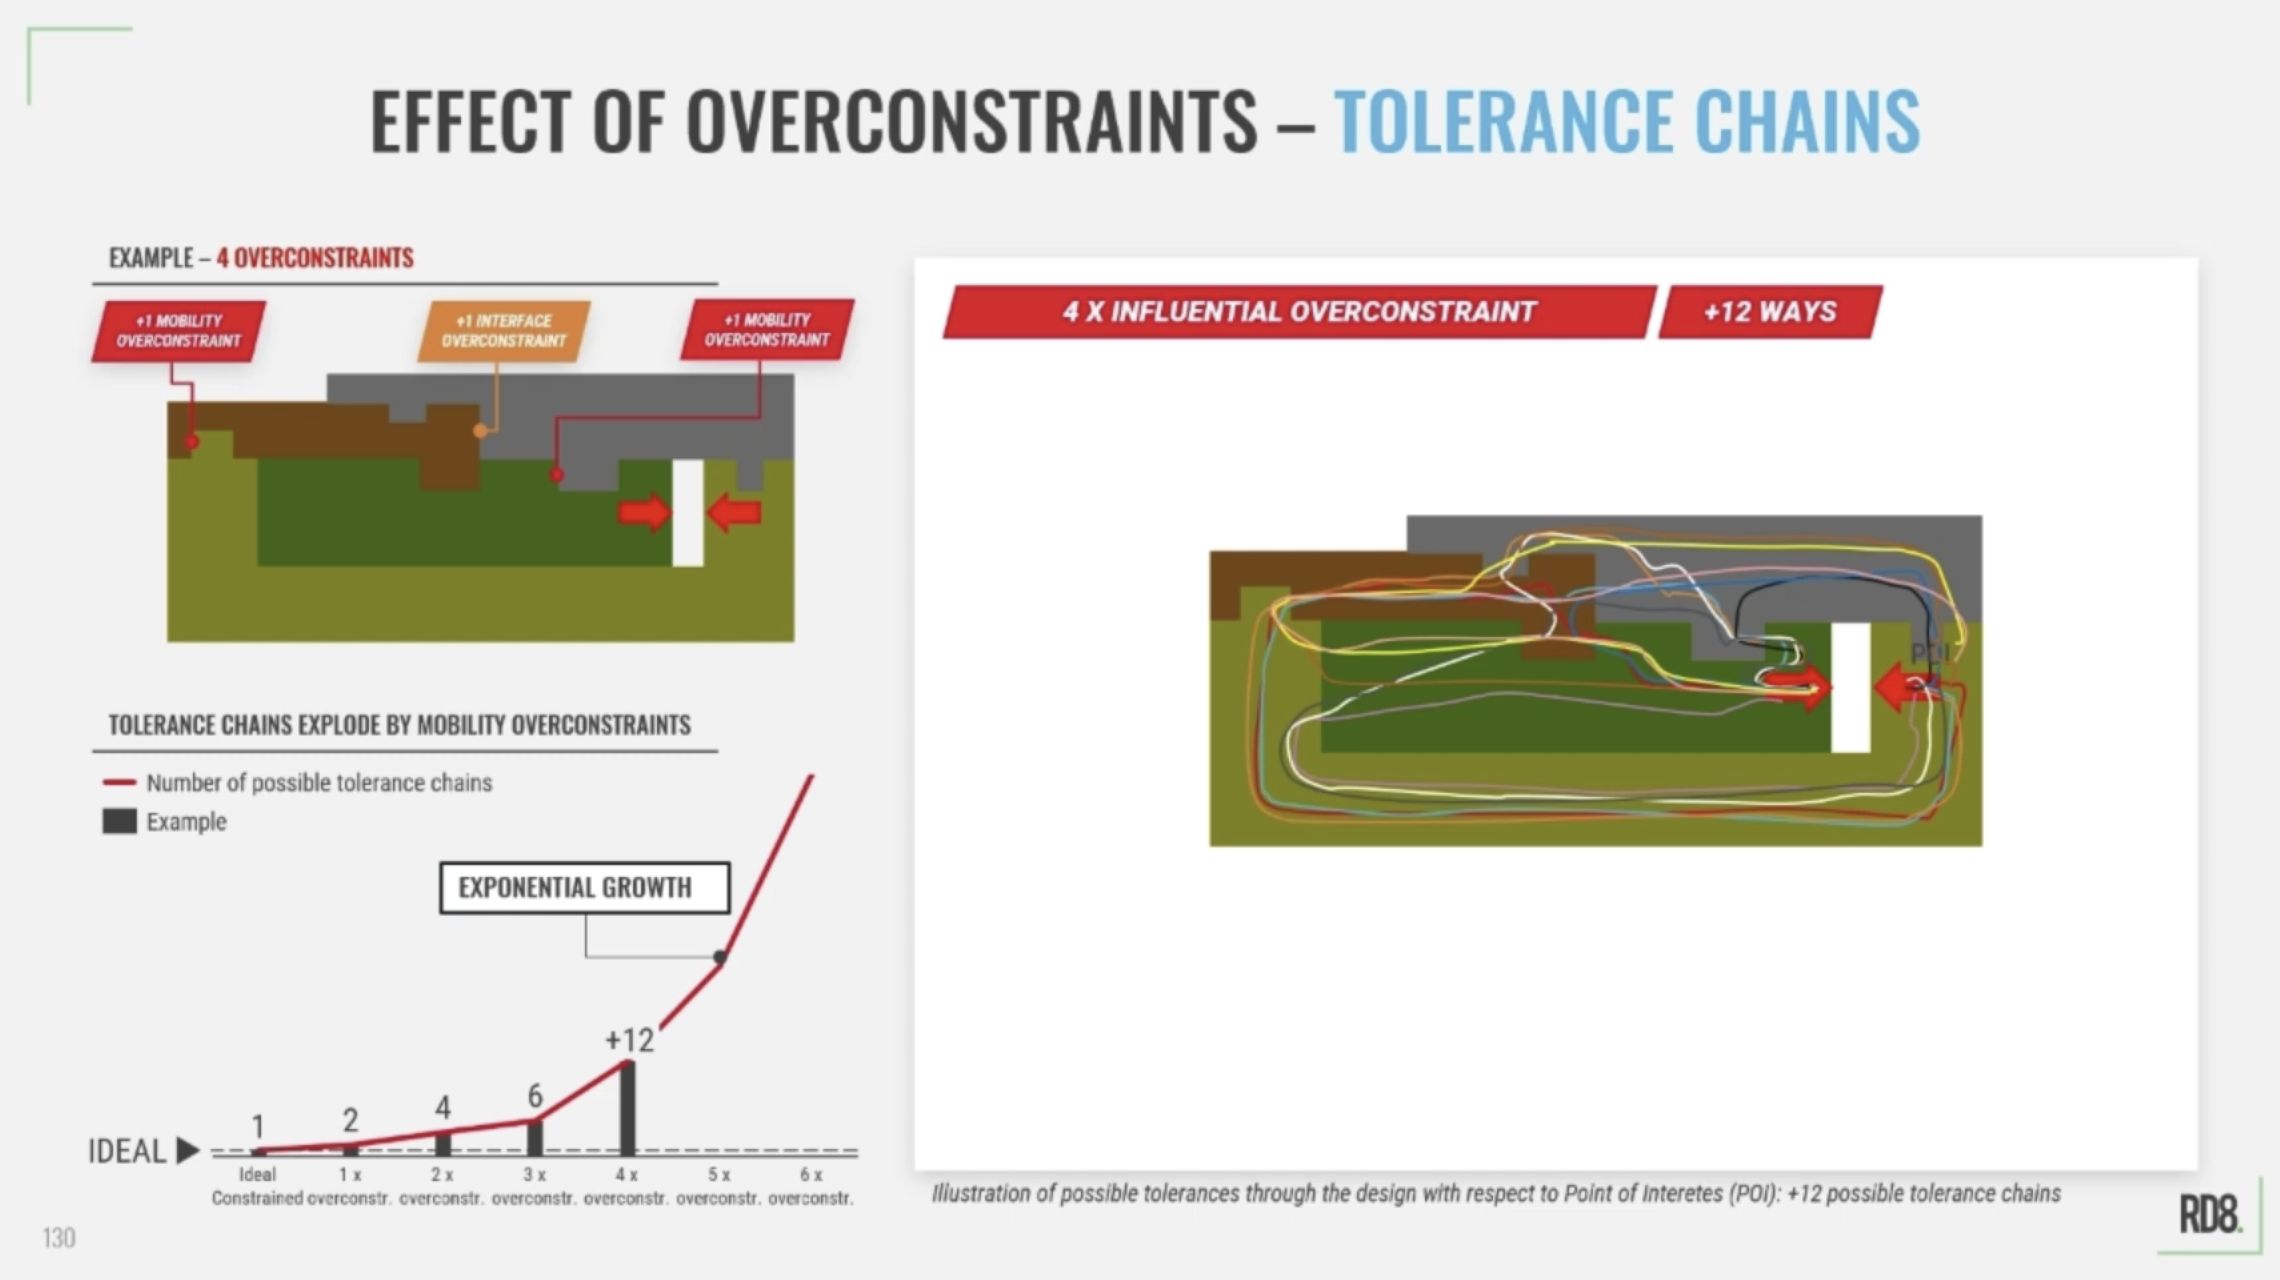
Be careful! Overconstrained Designs are the Root Cause for Complexity
• A single overconstrained can cause confusing - and make it difficult to set up a tolerance stack.
• Just by a few overconstraints - design complexity increased dramatically - almost exponentially.
• Avoid overconstraints in order to have full control of your tolerance stack.
Parameter Sensitivity and Optimization
In this step, we explore the concept of design sensitivity, showing how input variations can lead to significant changes in output, and how that affects the predictability and robustness of your design. Through practical examples and hands-on demonstrations, you'll learn how to reduce sensitivity and improve performance, while keeping tolerances (manufacturing costs) under control.
Lower the Slope to Achieve Robustness
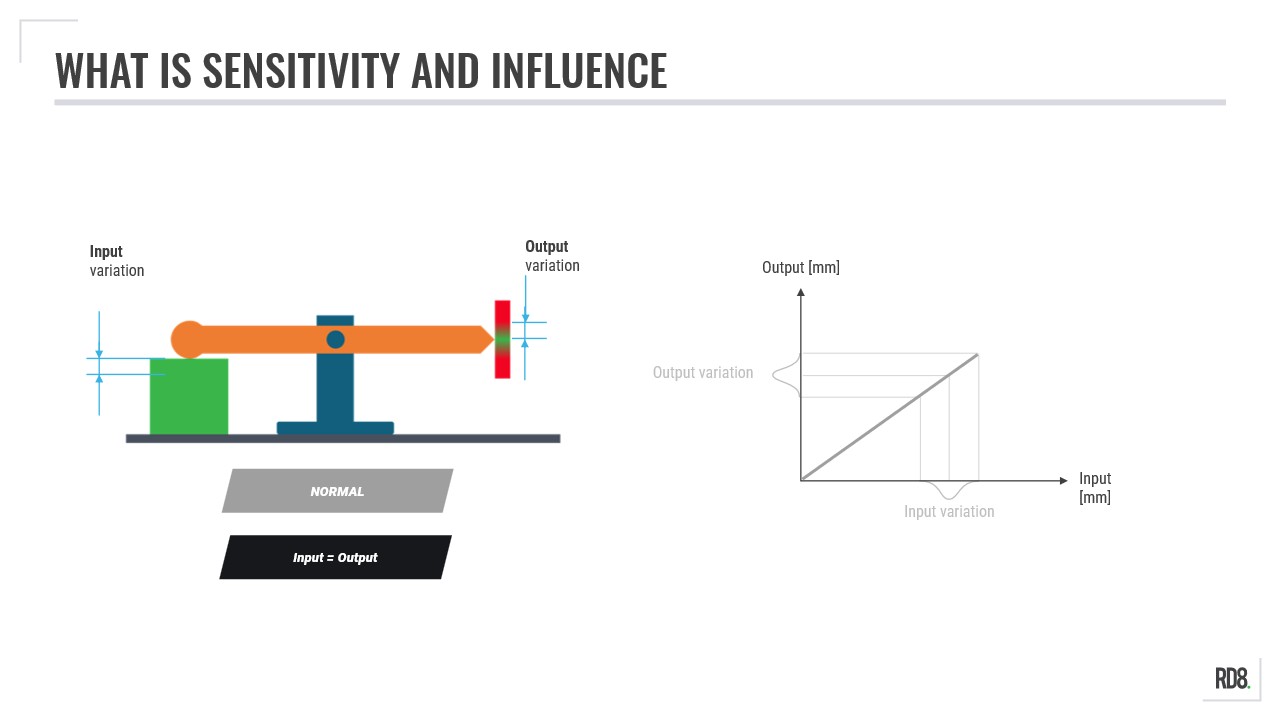
Sensitivity is represented by the slope of the curve when you plot the input parameter and the output.
• Neutral ("45 degree slope"):
input variation = output variation
• Sensitive design ("steep slope"):
input variation --> high variation of the output
• Robust design ("low slope"):
input variation --> low output variation
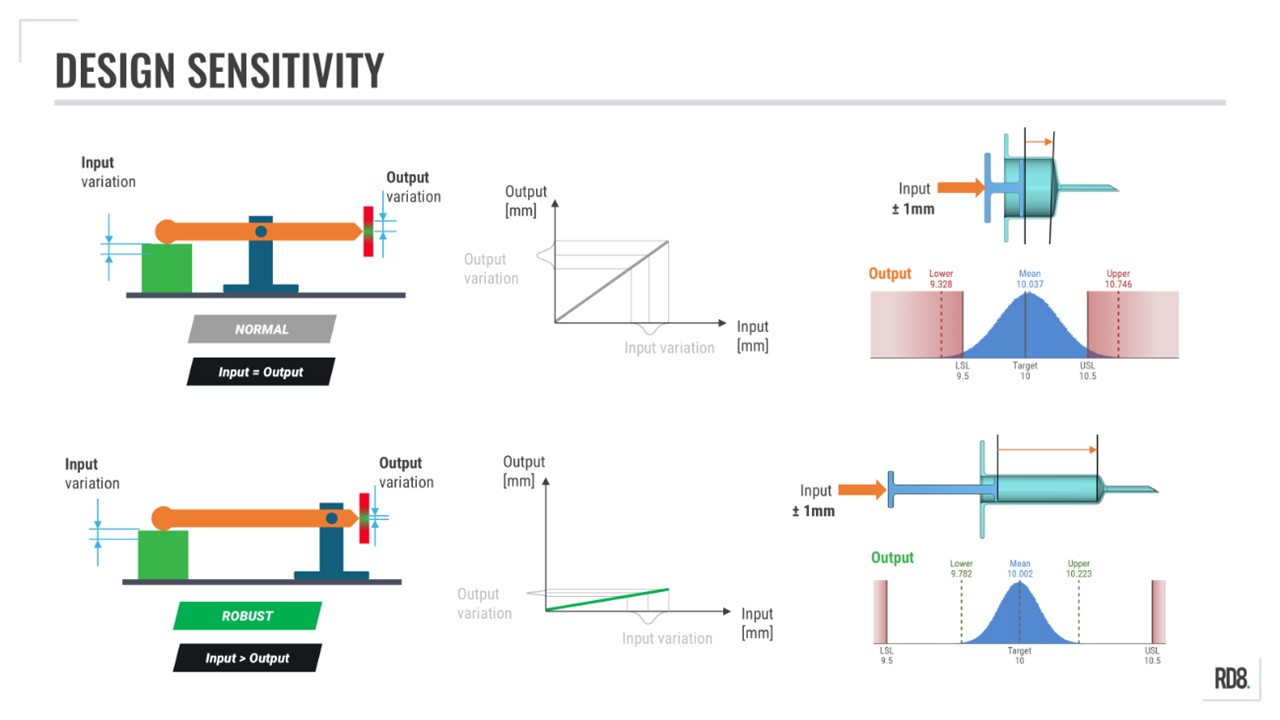
Example of Sensitivity: Lever arm and Syringe
Two syringes with same nominal dose can have very different accuracy levels depending on their geometry.
• Sensitive design = short stroke and big diameter
• Robust design = long stroke and small diameter
• In the syringe example – both cases have the same input; but a very different output
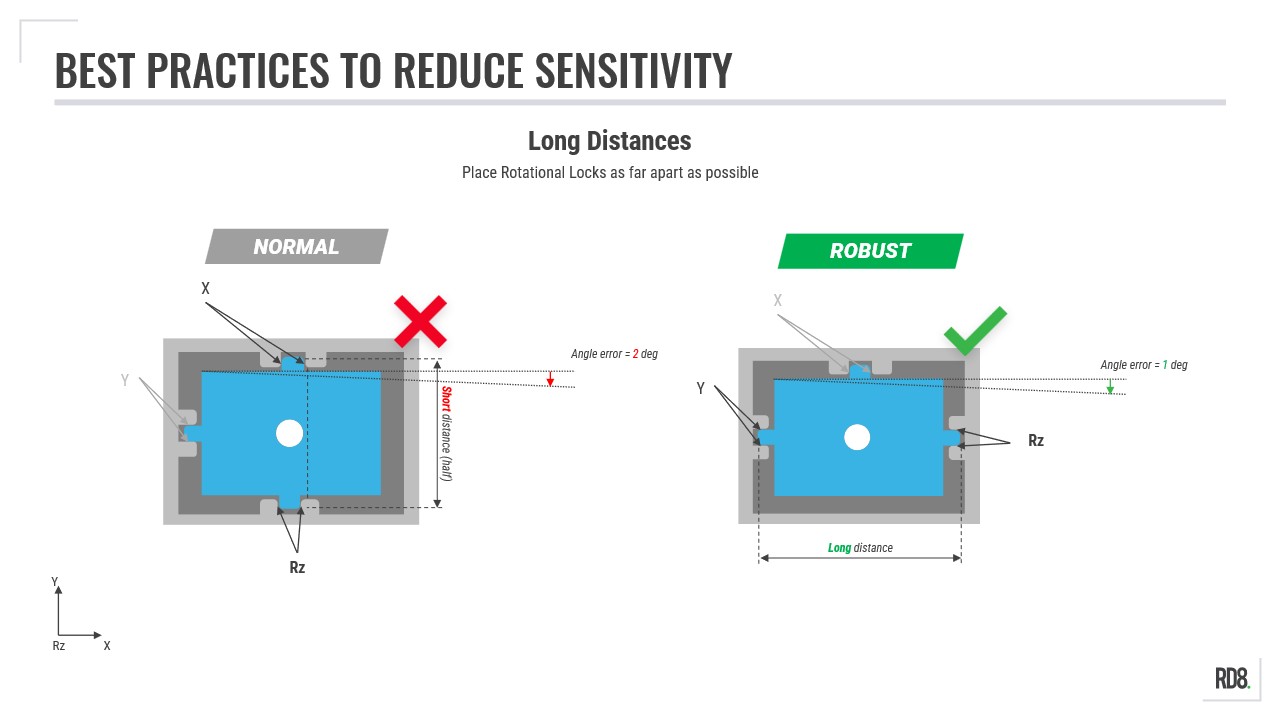
Best Practice: Increasing the Distance between Rotational Locks
• Placing constraining features far apart = robust design: low angular sensitivity
• Placing constraining features with small distance = sensitive design: high angular sensitivity
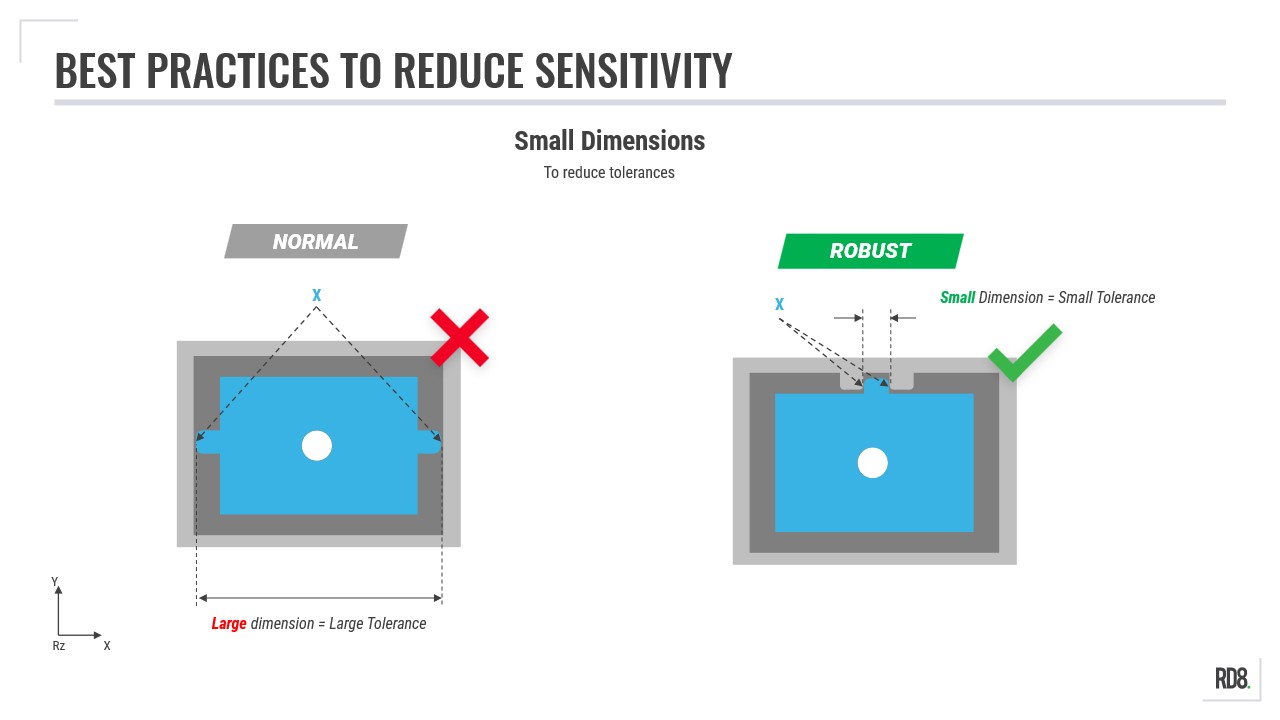
Best Practice: Use Smaller Dimensions
When designing interfaces between parts - size matters. Smaller dimensions is easier to keep in control (smaller tolerances). Keep that in mind if you are in the quest for low variation.
Small dimensions = small tolerances = lower variation
Larger dimensions = large tolerances = higher variation
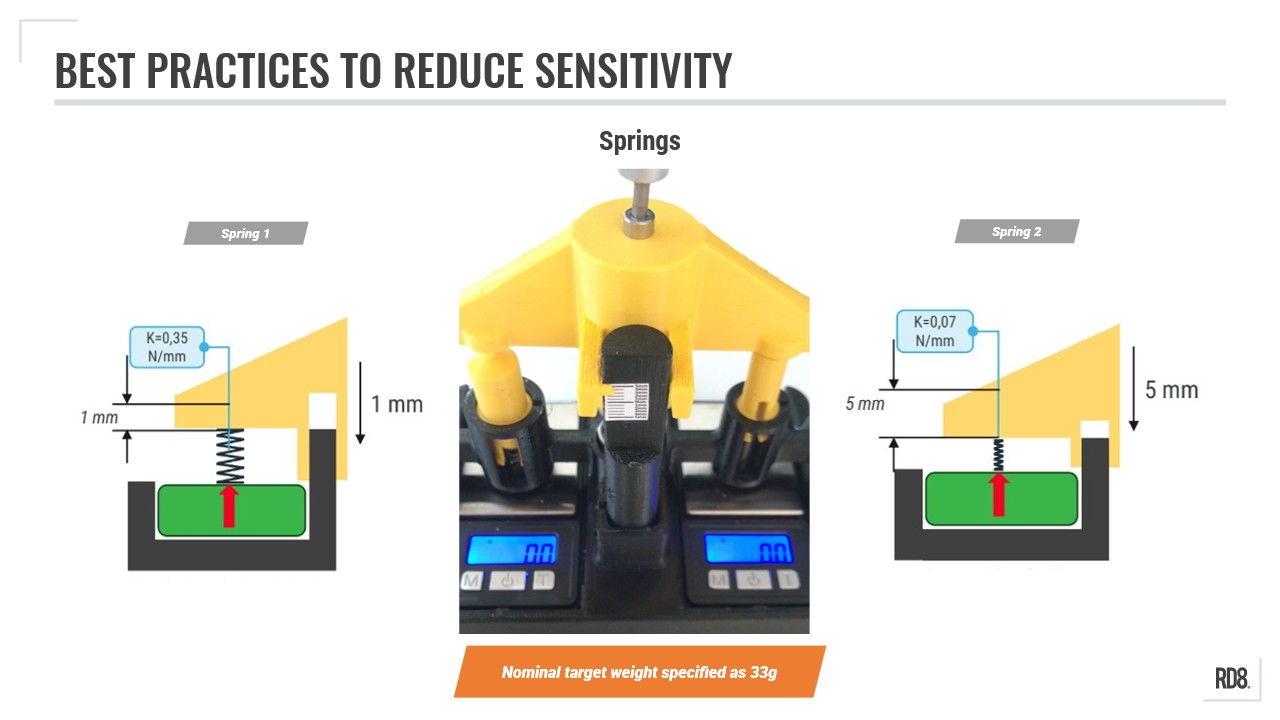
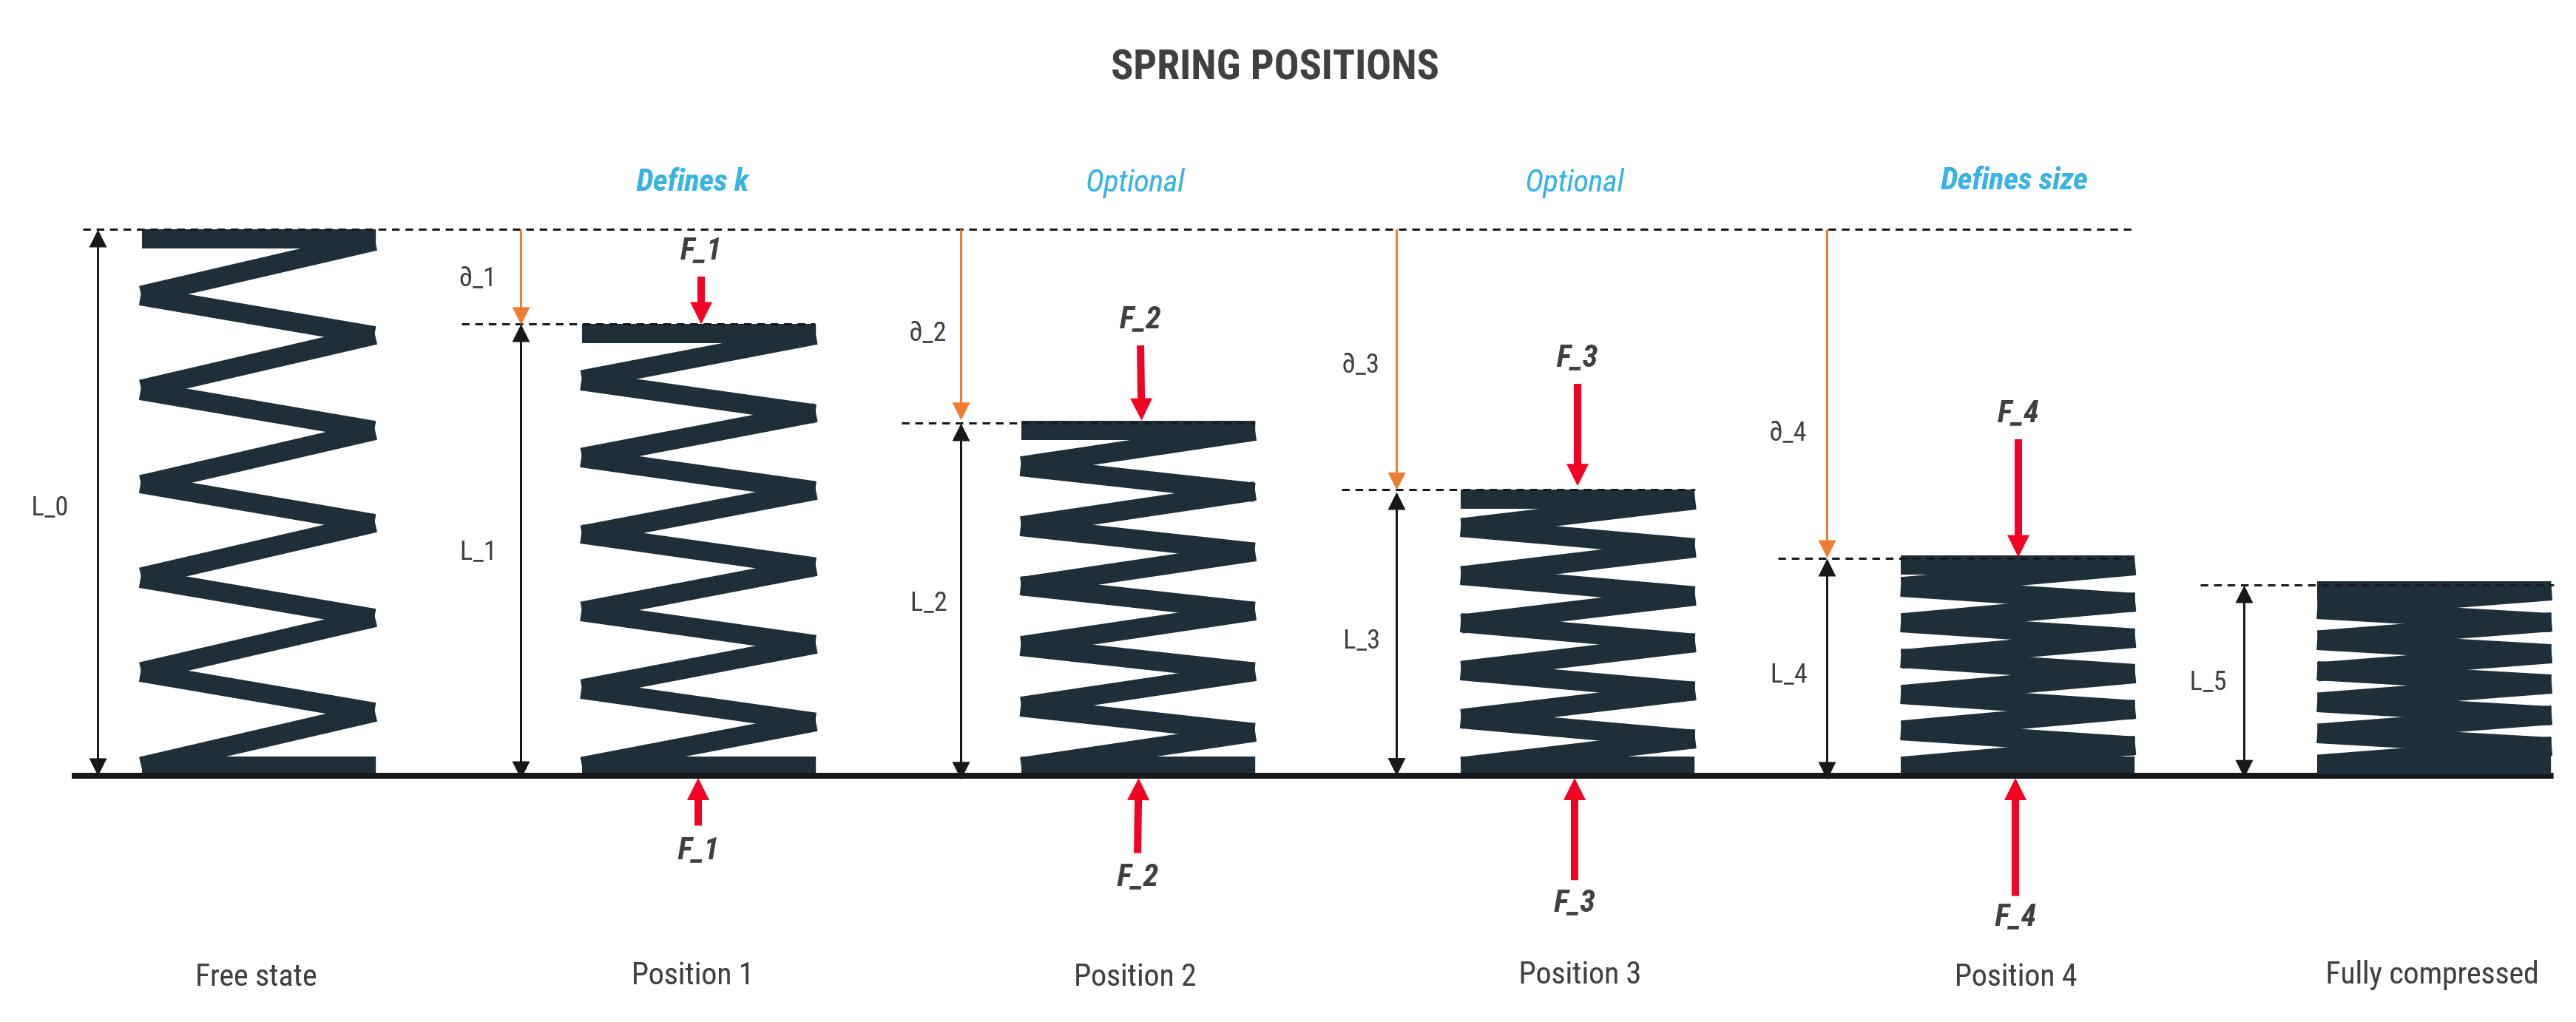
Best Practice: Use Long, Soft Springs
• Springs with lower stiffness → lower sensitivity to variation
• Springs with greater stiffness → higher sensitivity to variation
Note: a spring with lower stiffness require more pretention to obtain the same force
Tip: the same goes for parts or compliant mechanisms (if you consider part stiffness as springs you will get the same results)
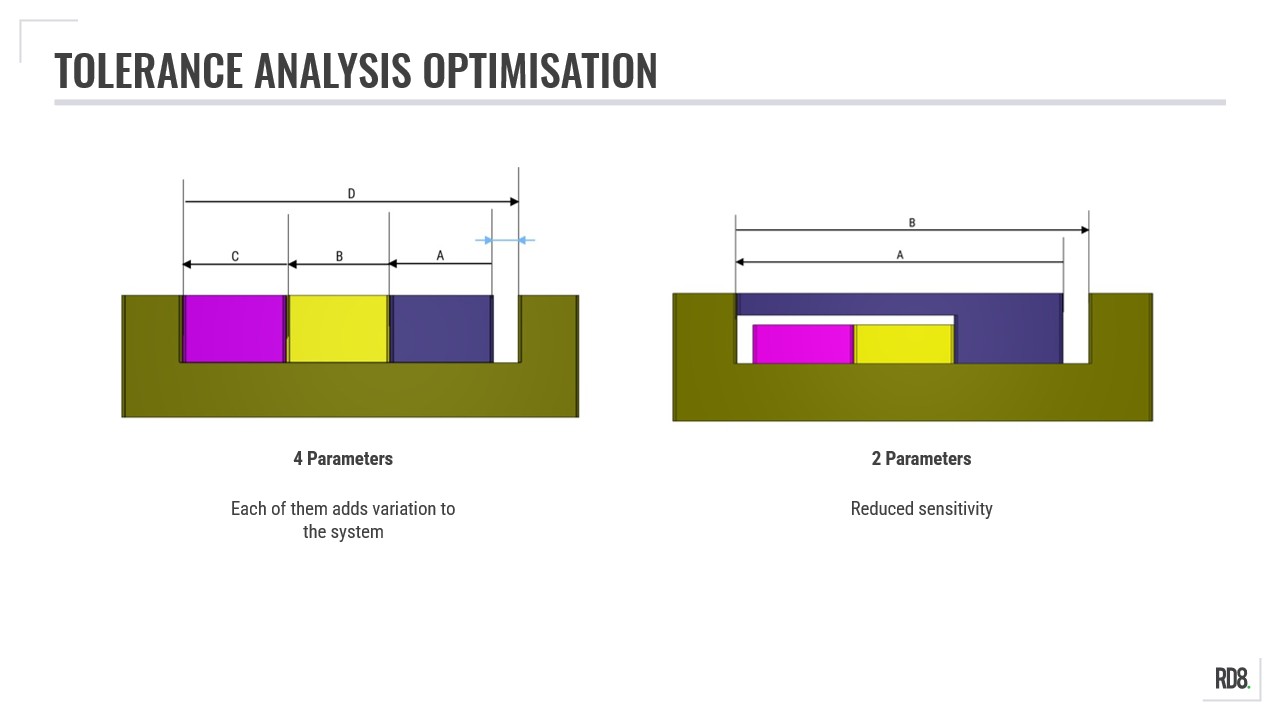
Best Practice: Short Tolerance Stacks
To reduce variation - shorten the tolerance stack as much as possible. The fewer parts and/or features the better.
• Sensitive design = many dimensions/parts in a tolerance stack
• Robust design = few dimensions/parts in a tolerance stack
Multidimensional Stacks - What is the Difference Between 1D, 2D, and a 3D Stack?
In this step, the notion of 2D- and 3D-stacks are explored and explained.
The main point for a Robust Design Engineer is how to reduce the need for complex 3D stacks. The goal is to reinforce any design changes than can simplify calculations and documentations. The overarching design principle originates from Axiomatic Design by Nam Pyo Suh (principles originate from 1977) - Axiom 2- where the objective is to minimize as much information as possible.
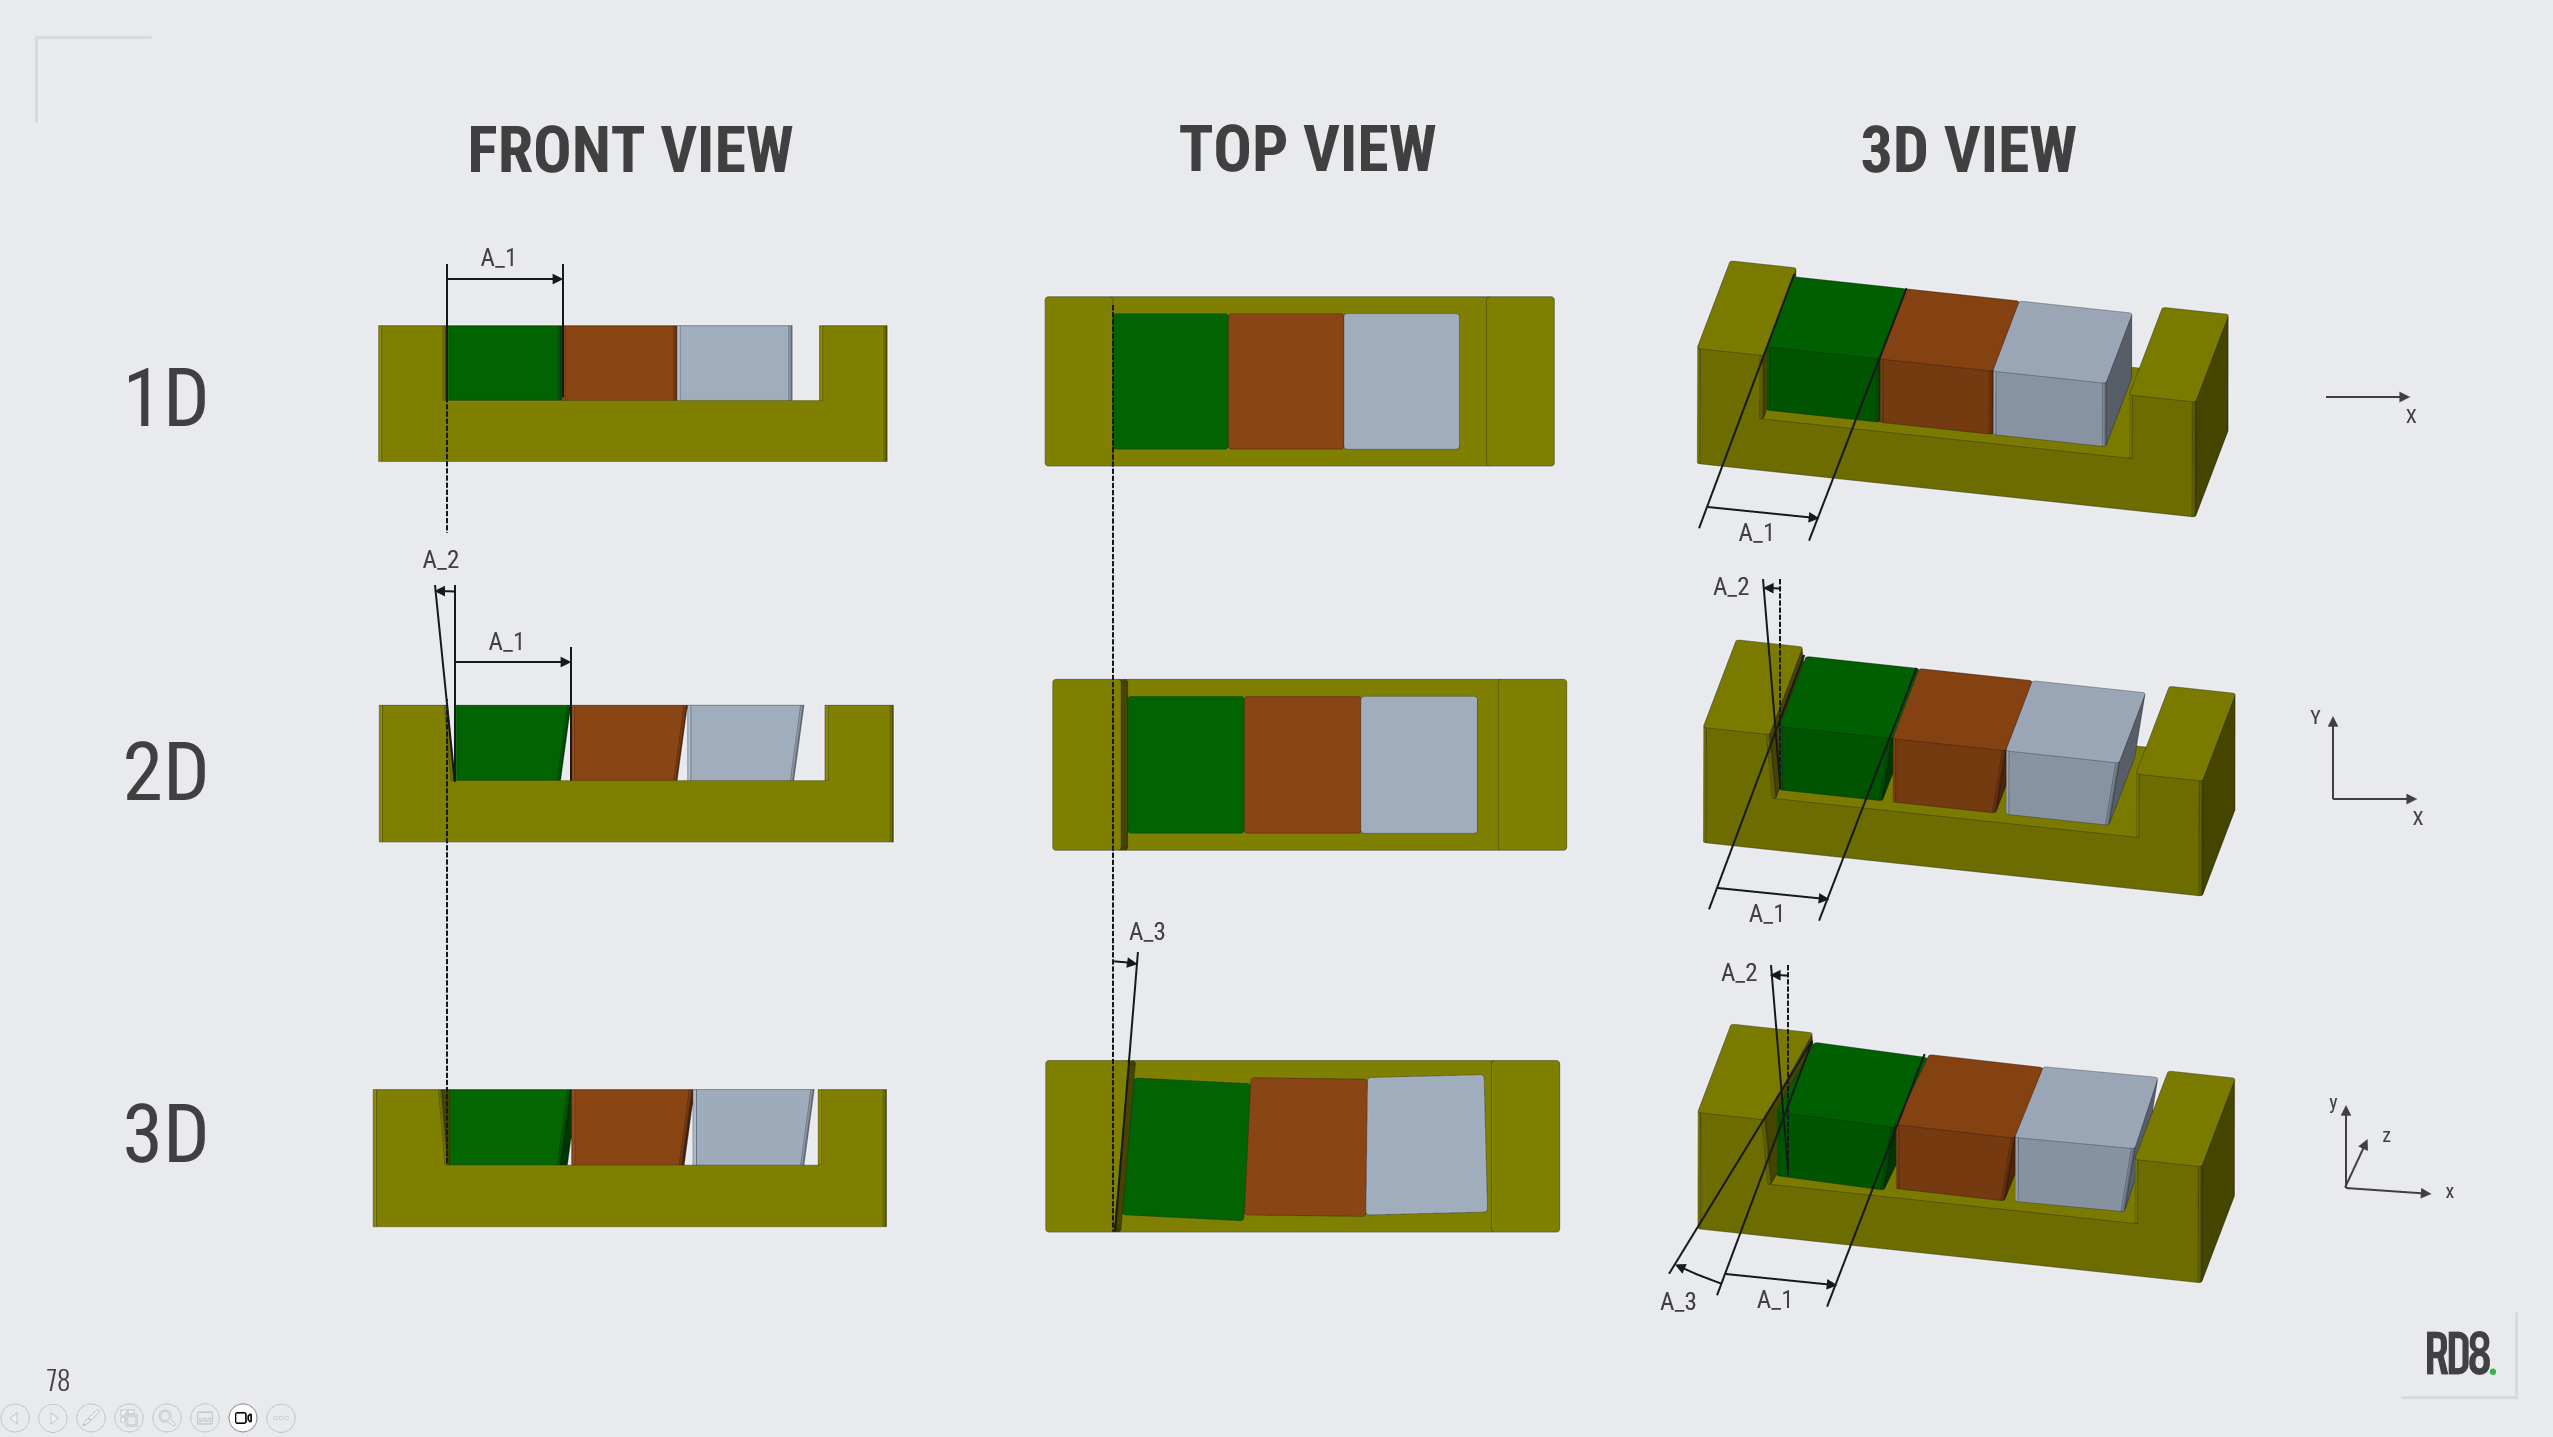
1D, 2D, and 3D
The difference between a 1D-, 2D-, and 3D-stack is summarized in the illustration.
1D: The width of the boxes and cradles are in scope.
2D: Imagine that the parts are not perfect along the y-axis. Any variation here should be included.
3D: Imagine that possible variation in the depth (z-axis) is included.
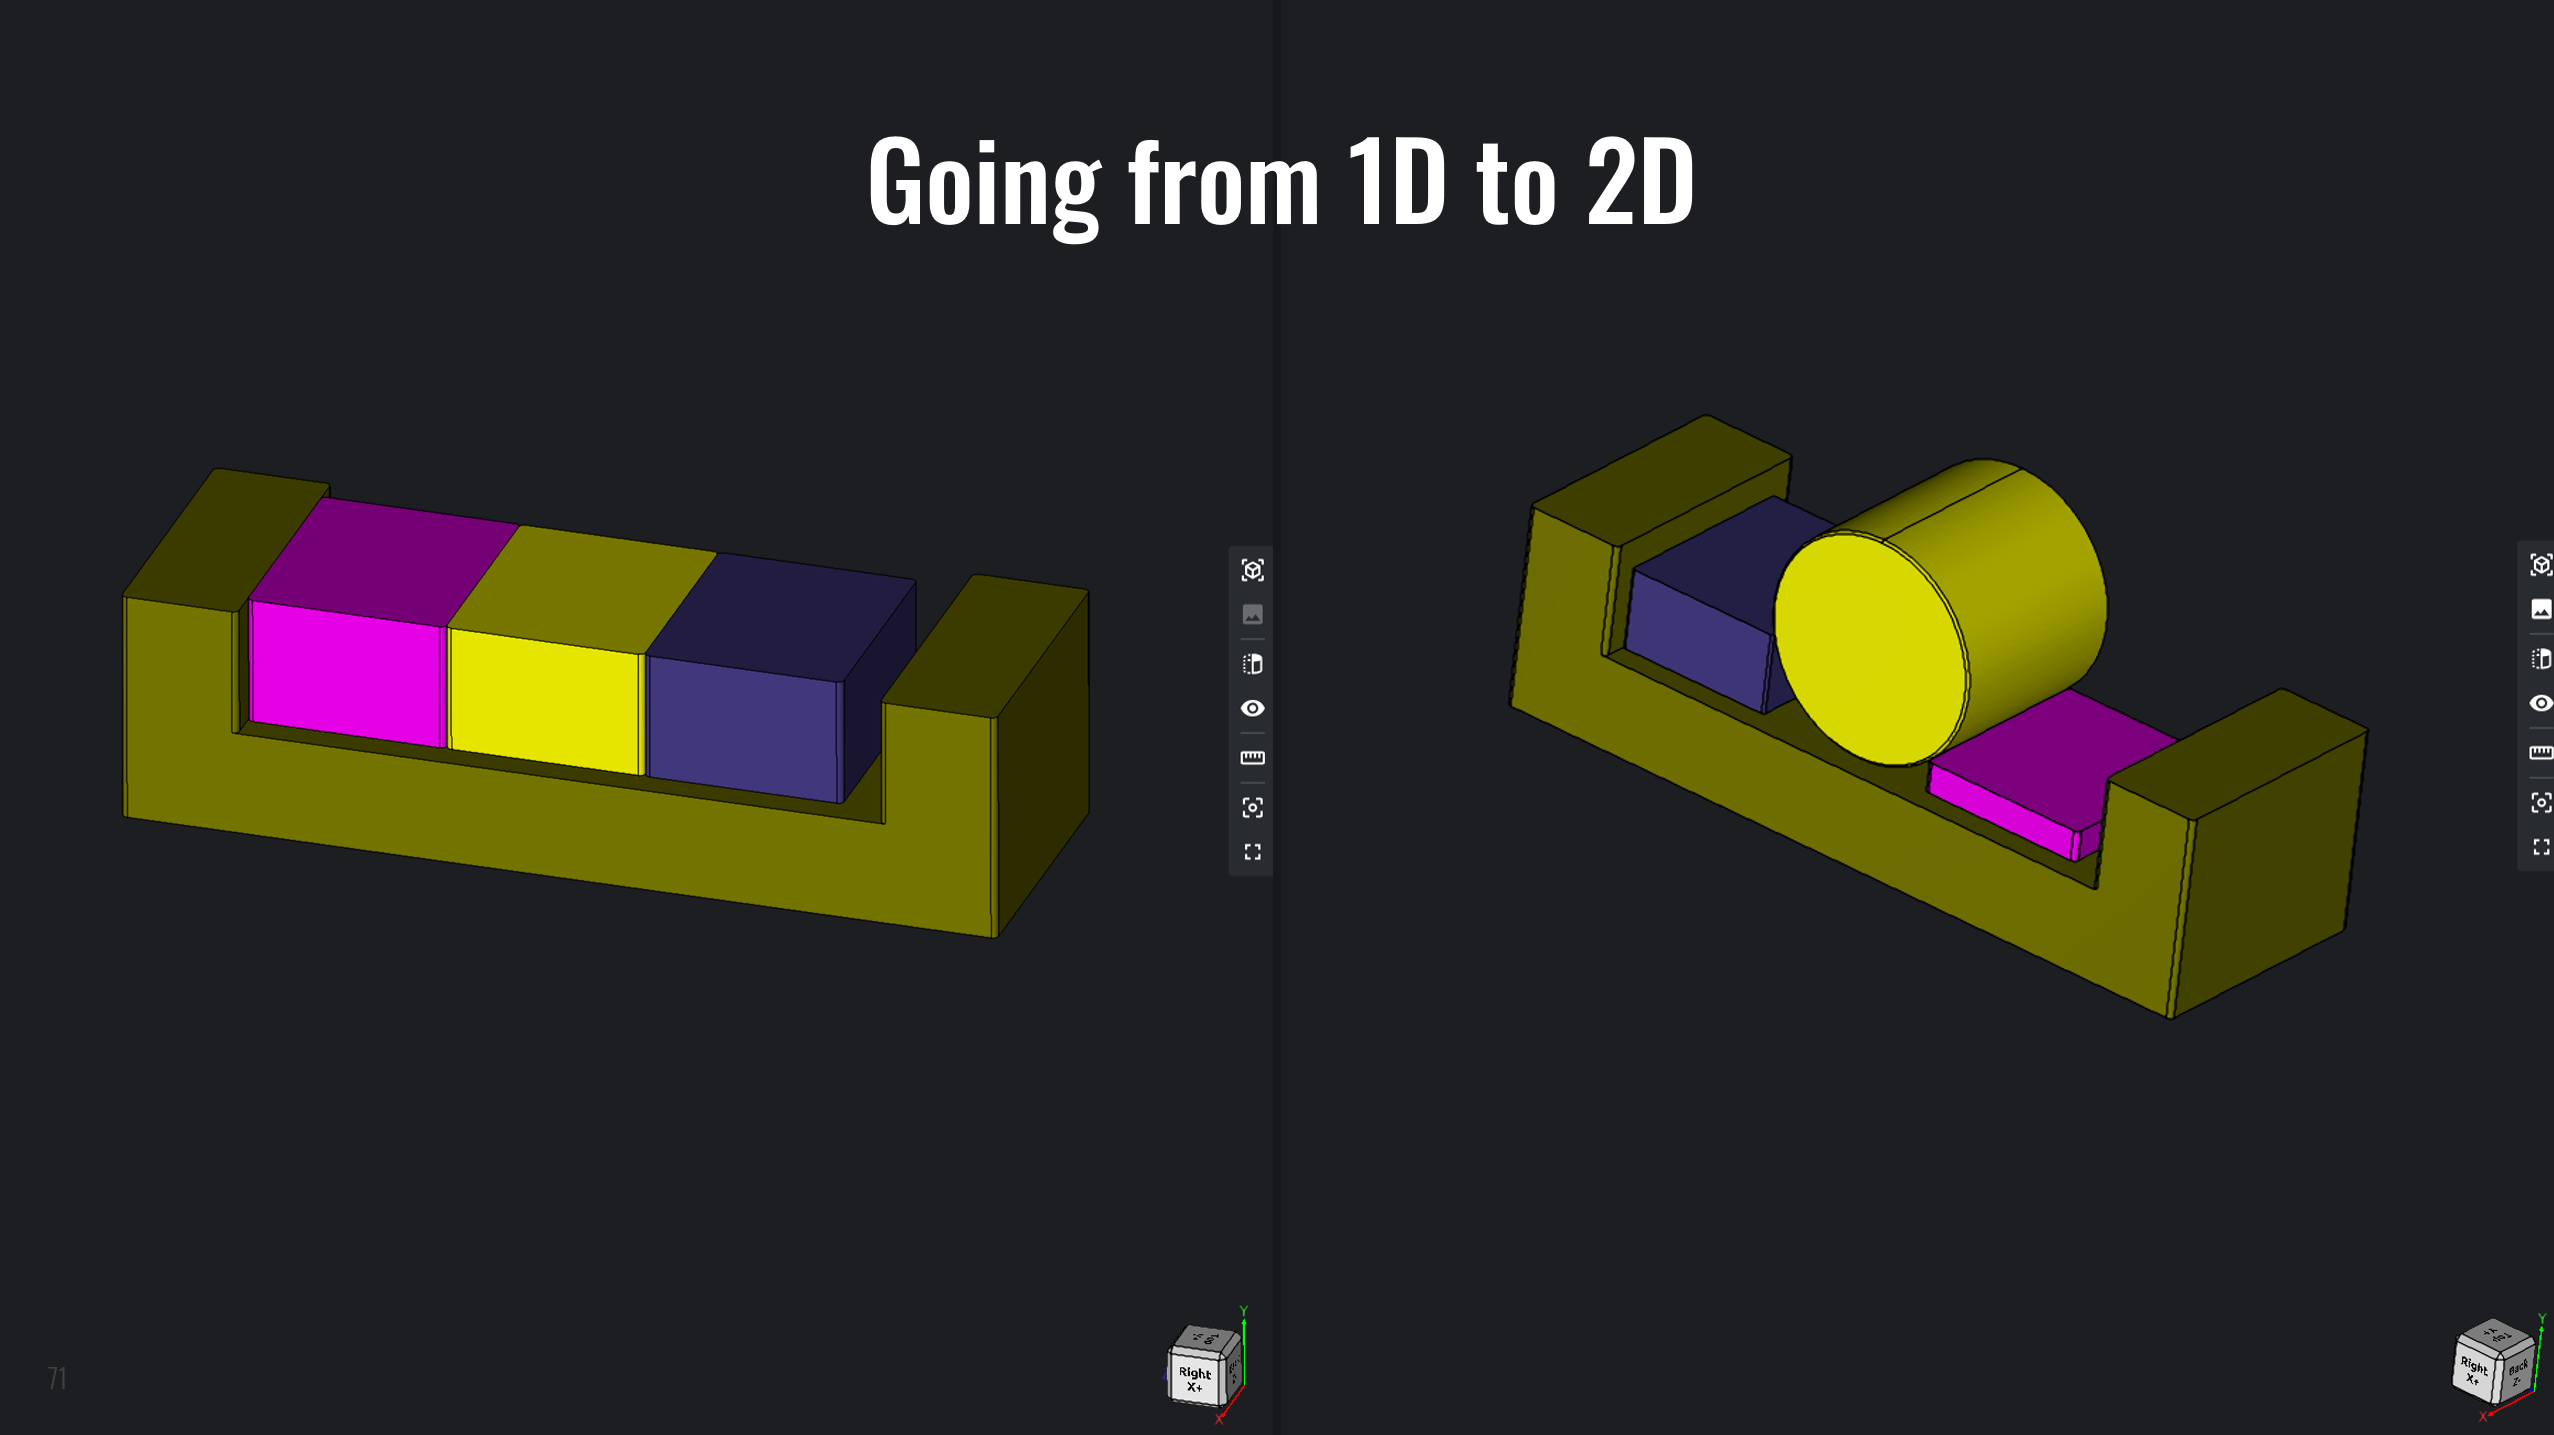
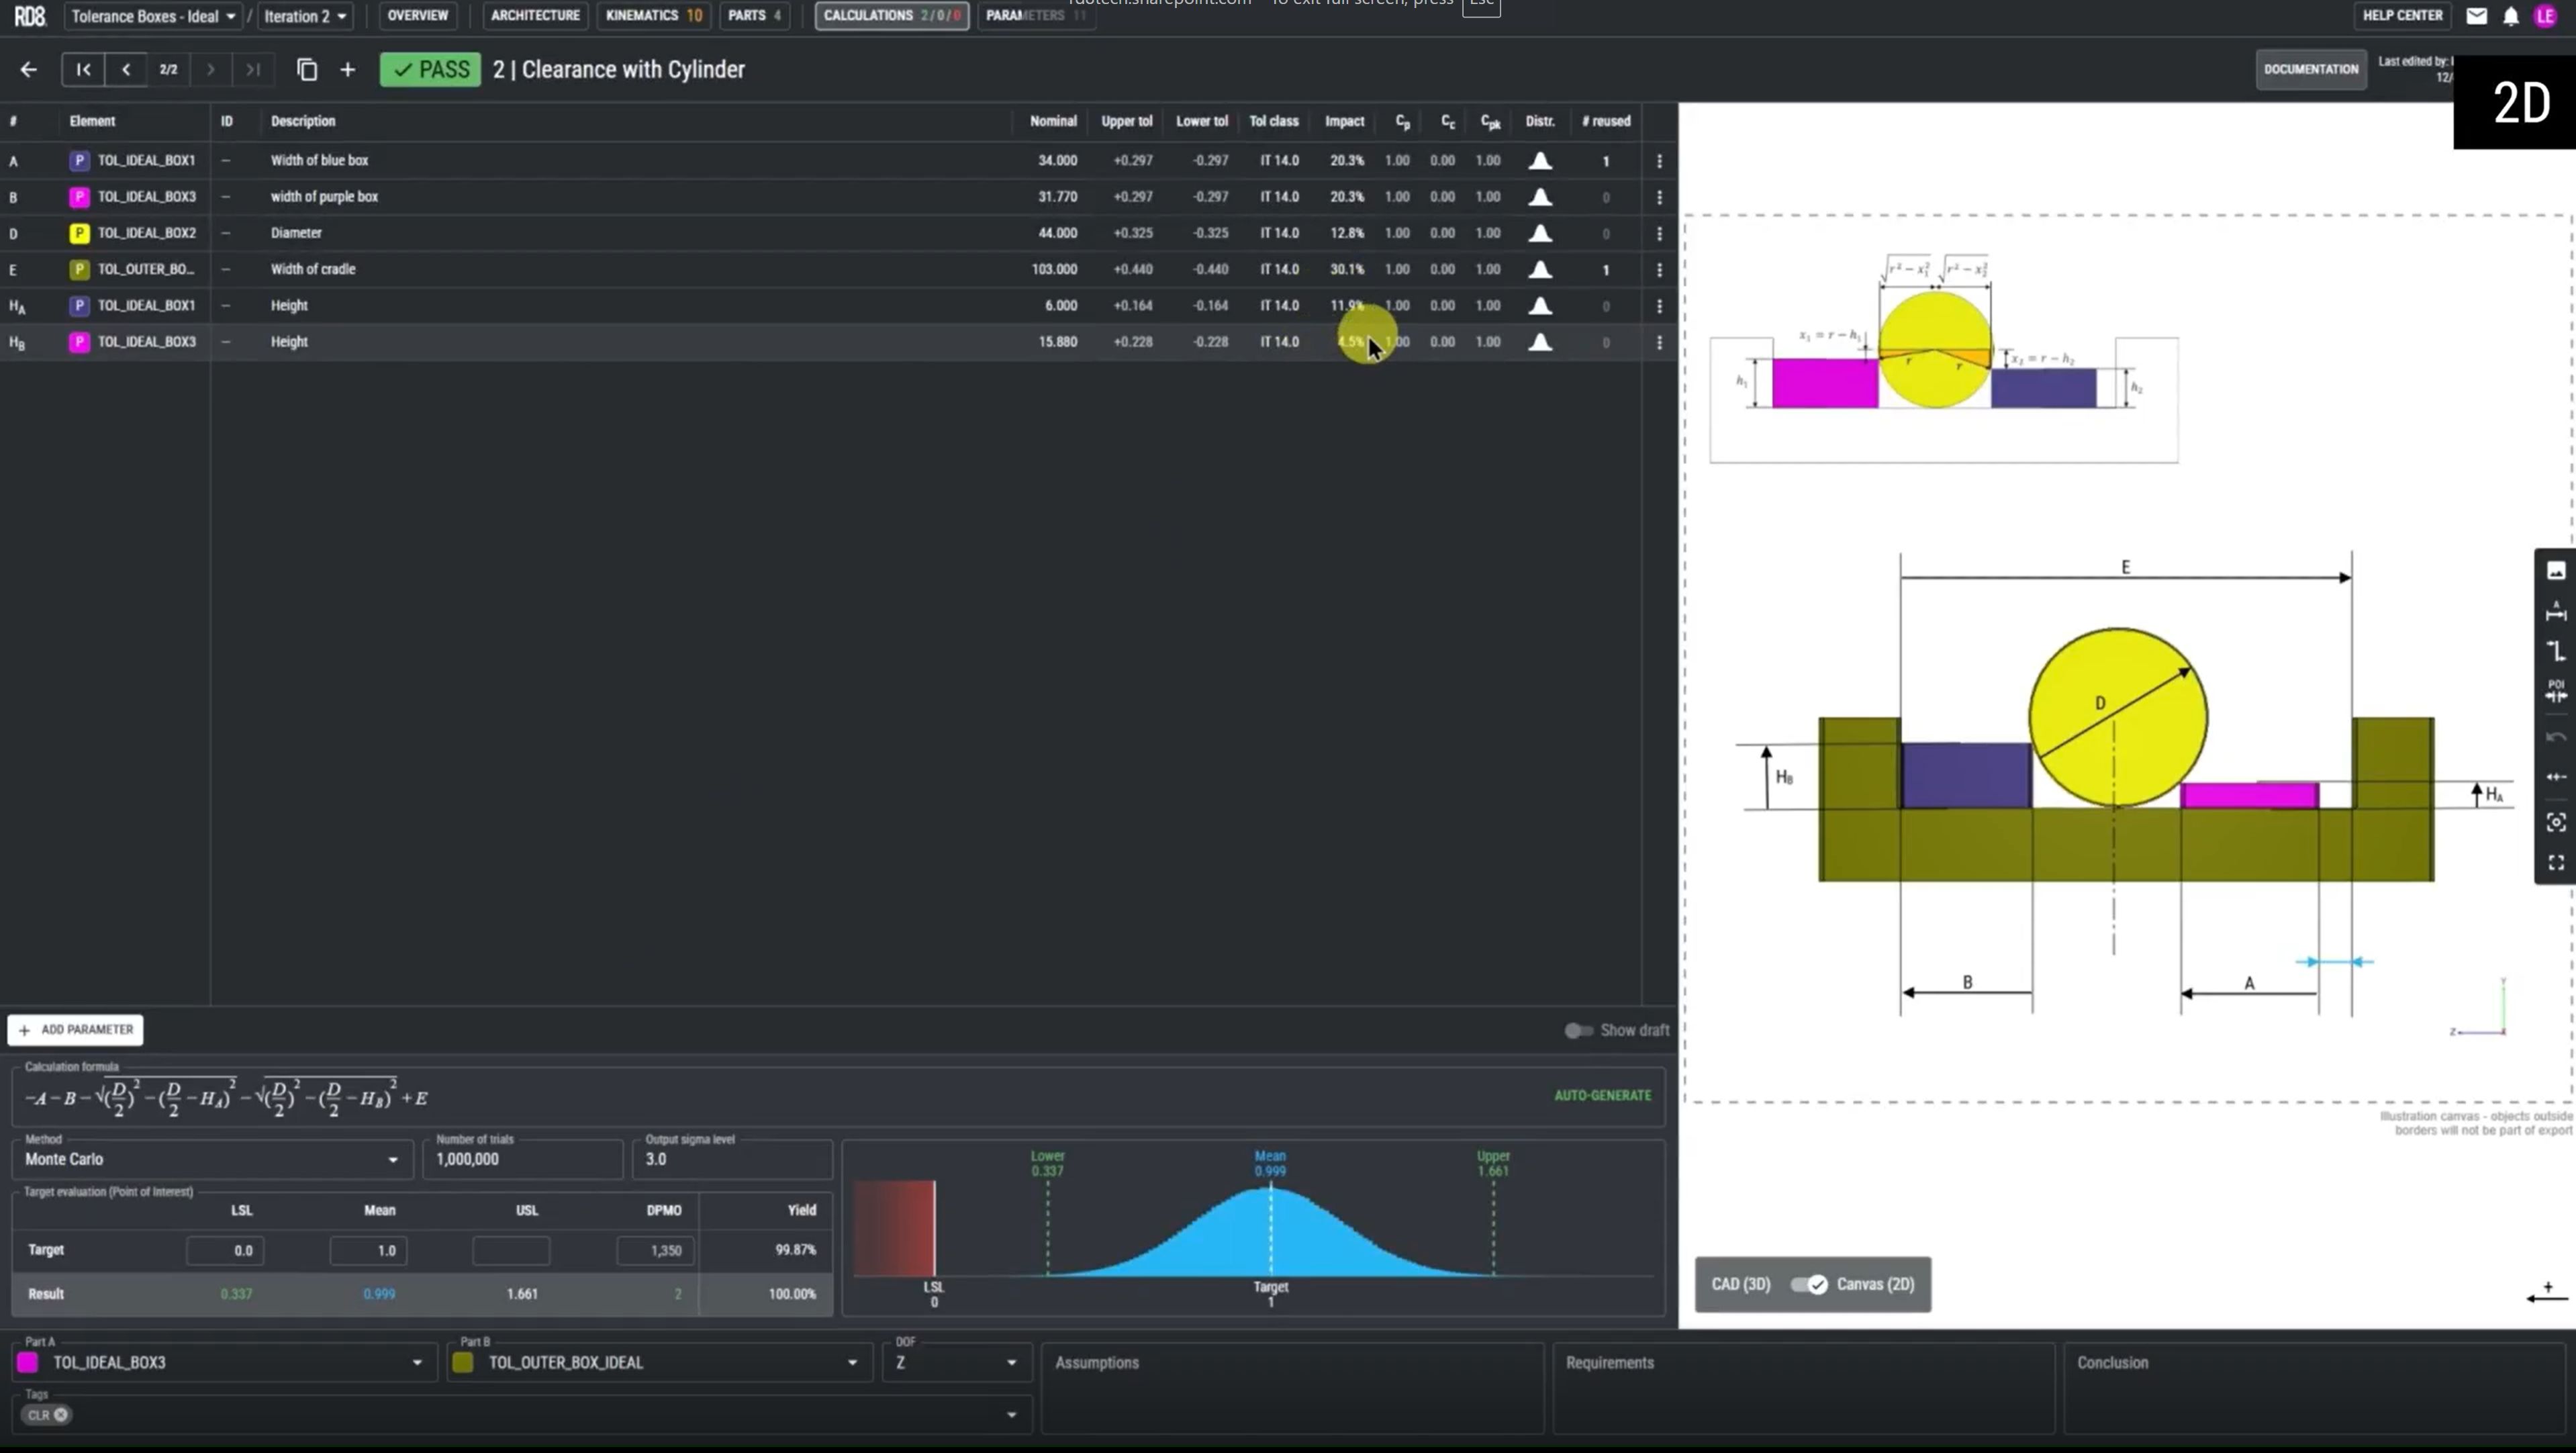
The Difference between 1D- and 2D-stack
In the example given. When changing the yellow box to a cylinder - suddenly the height of the purple and blue box starts to have an impact on the stack. Hence it becomes two-dimensional.
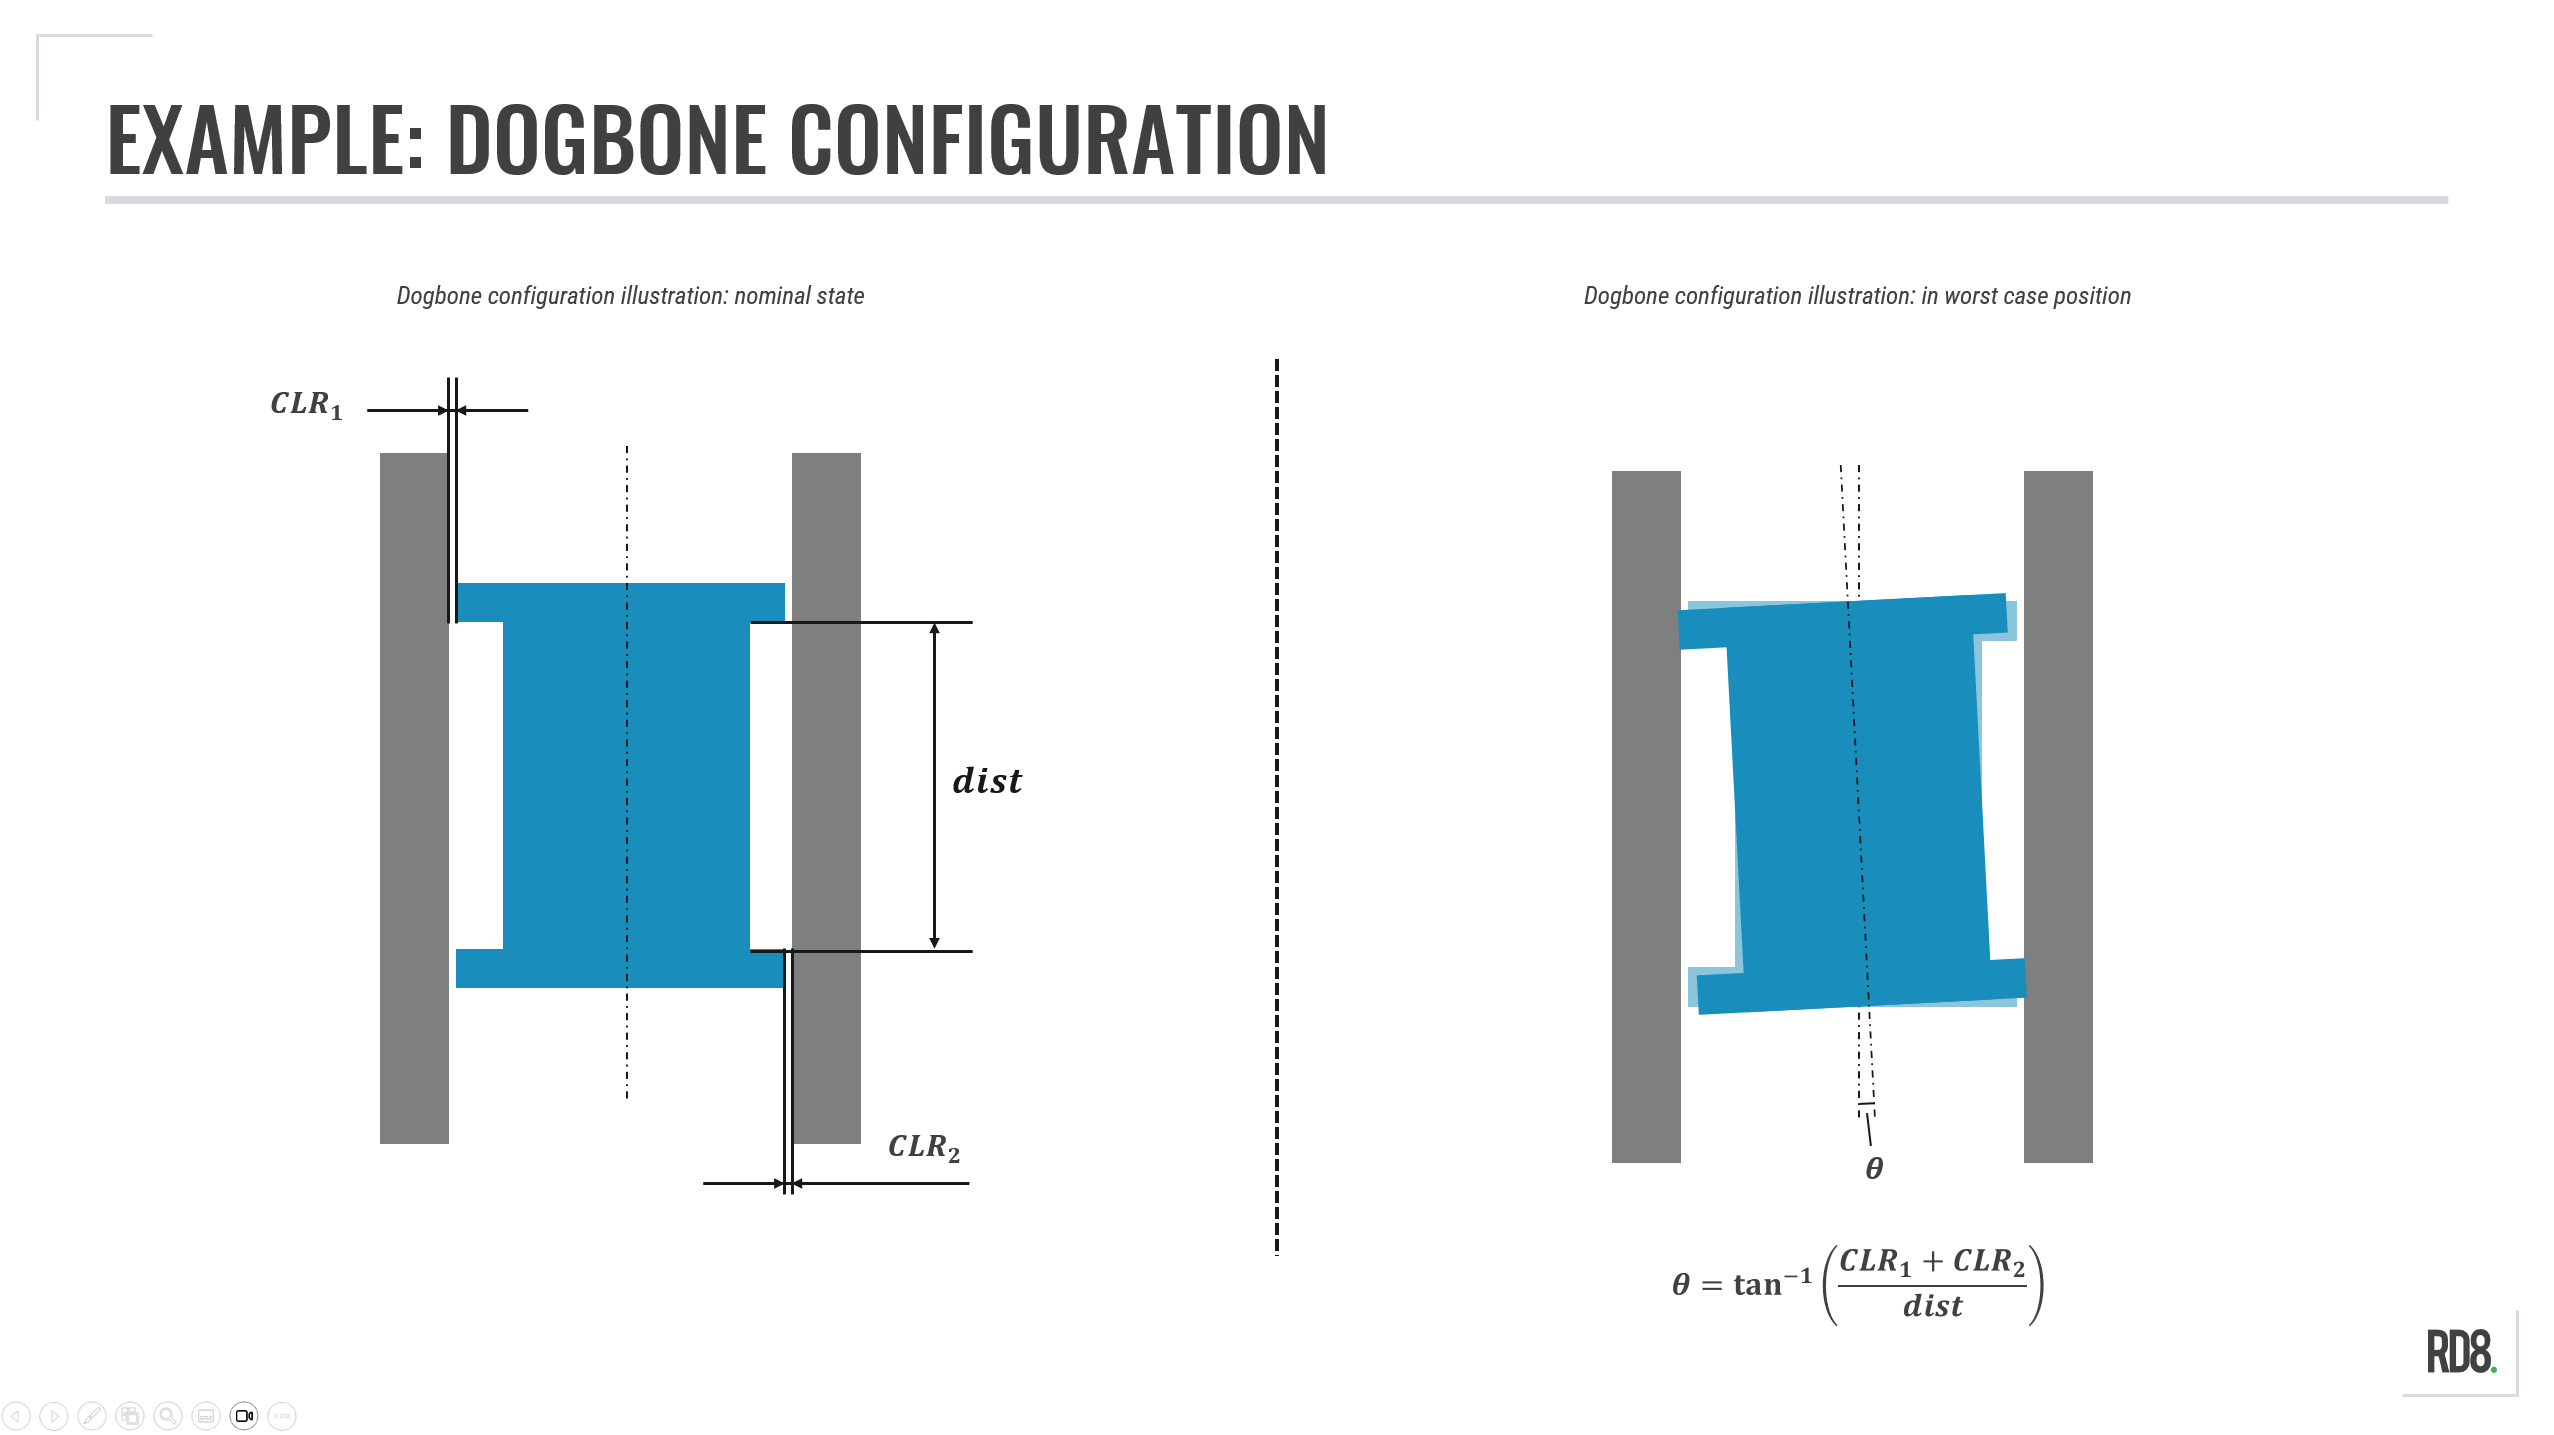
Dogbone Configuration Calculation
Many 2D stacks are a "dogbone" in disguise.
Clearances in two fits - in this example CLR_1 and CLR_2 - results in an angular displacement, θ.
Theta, θ, is given by:
θ = tan^(-1)( (CLR_1 + CLR_2) / dist) )
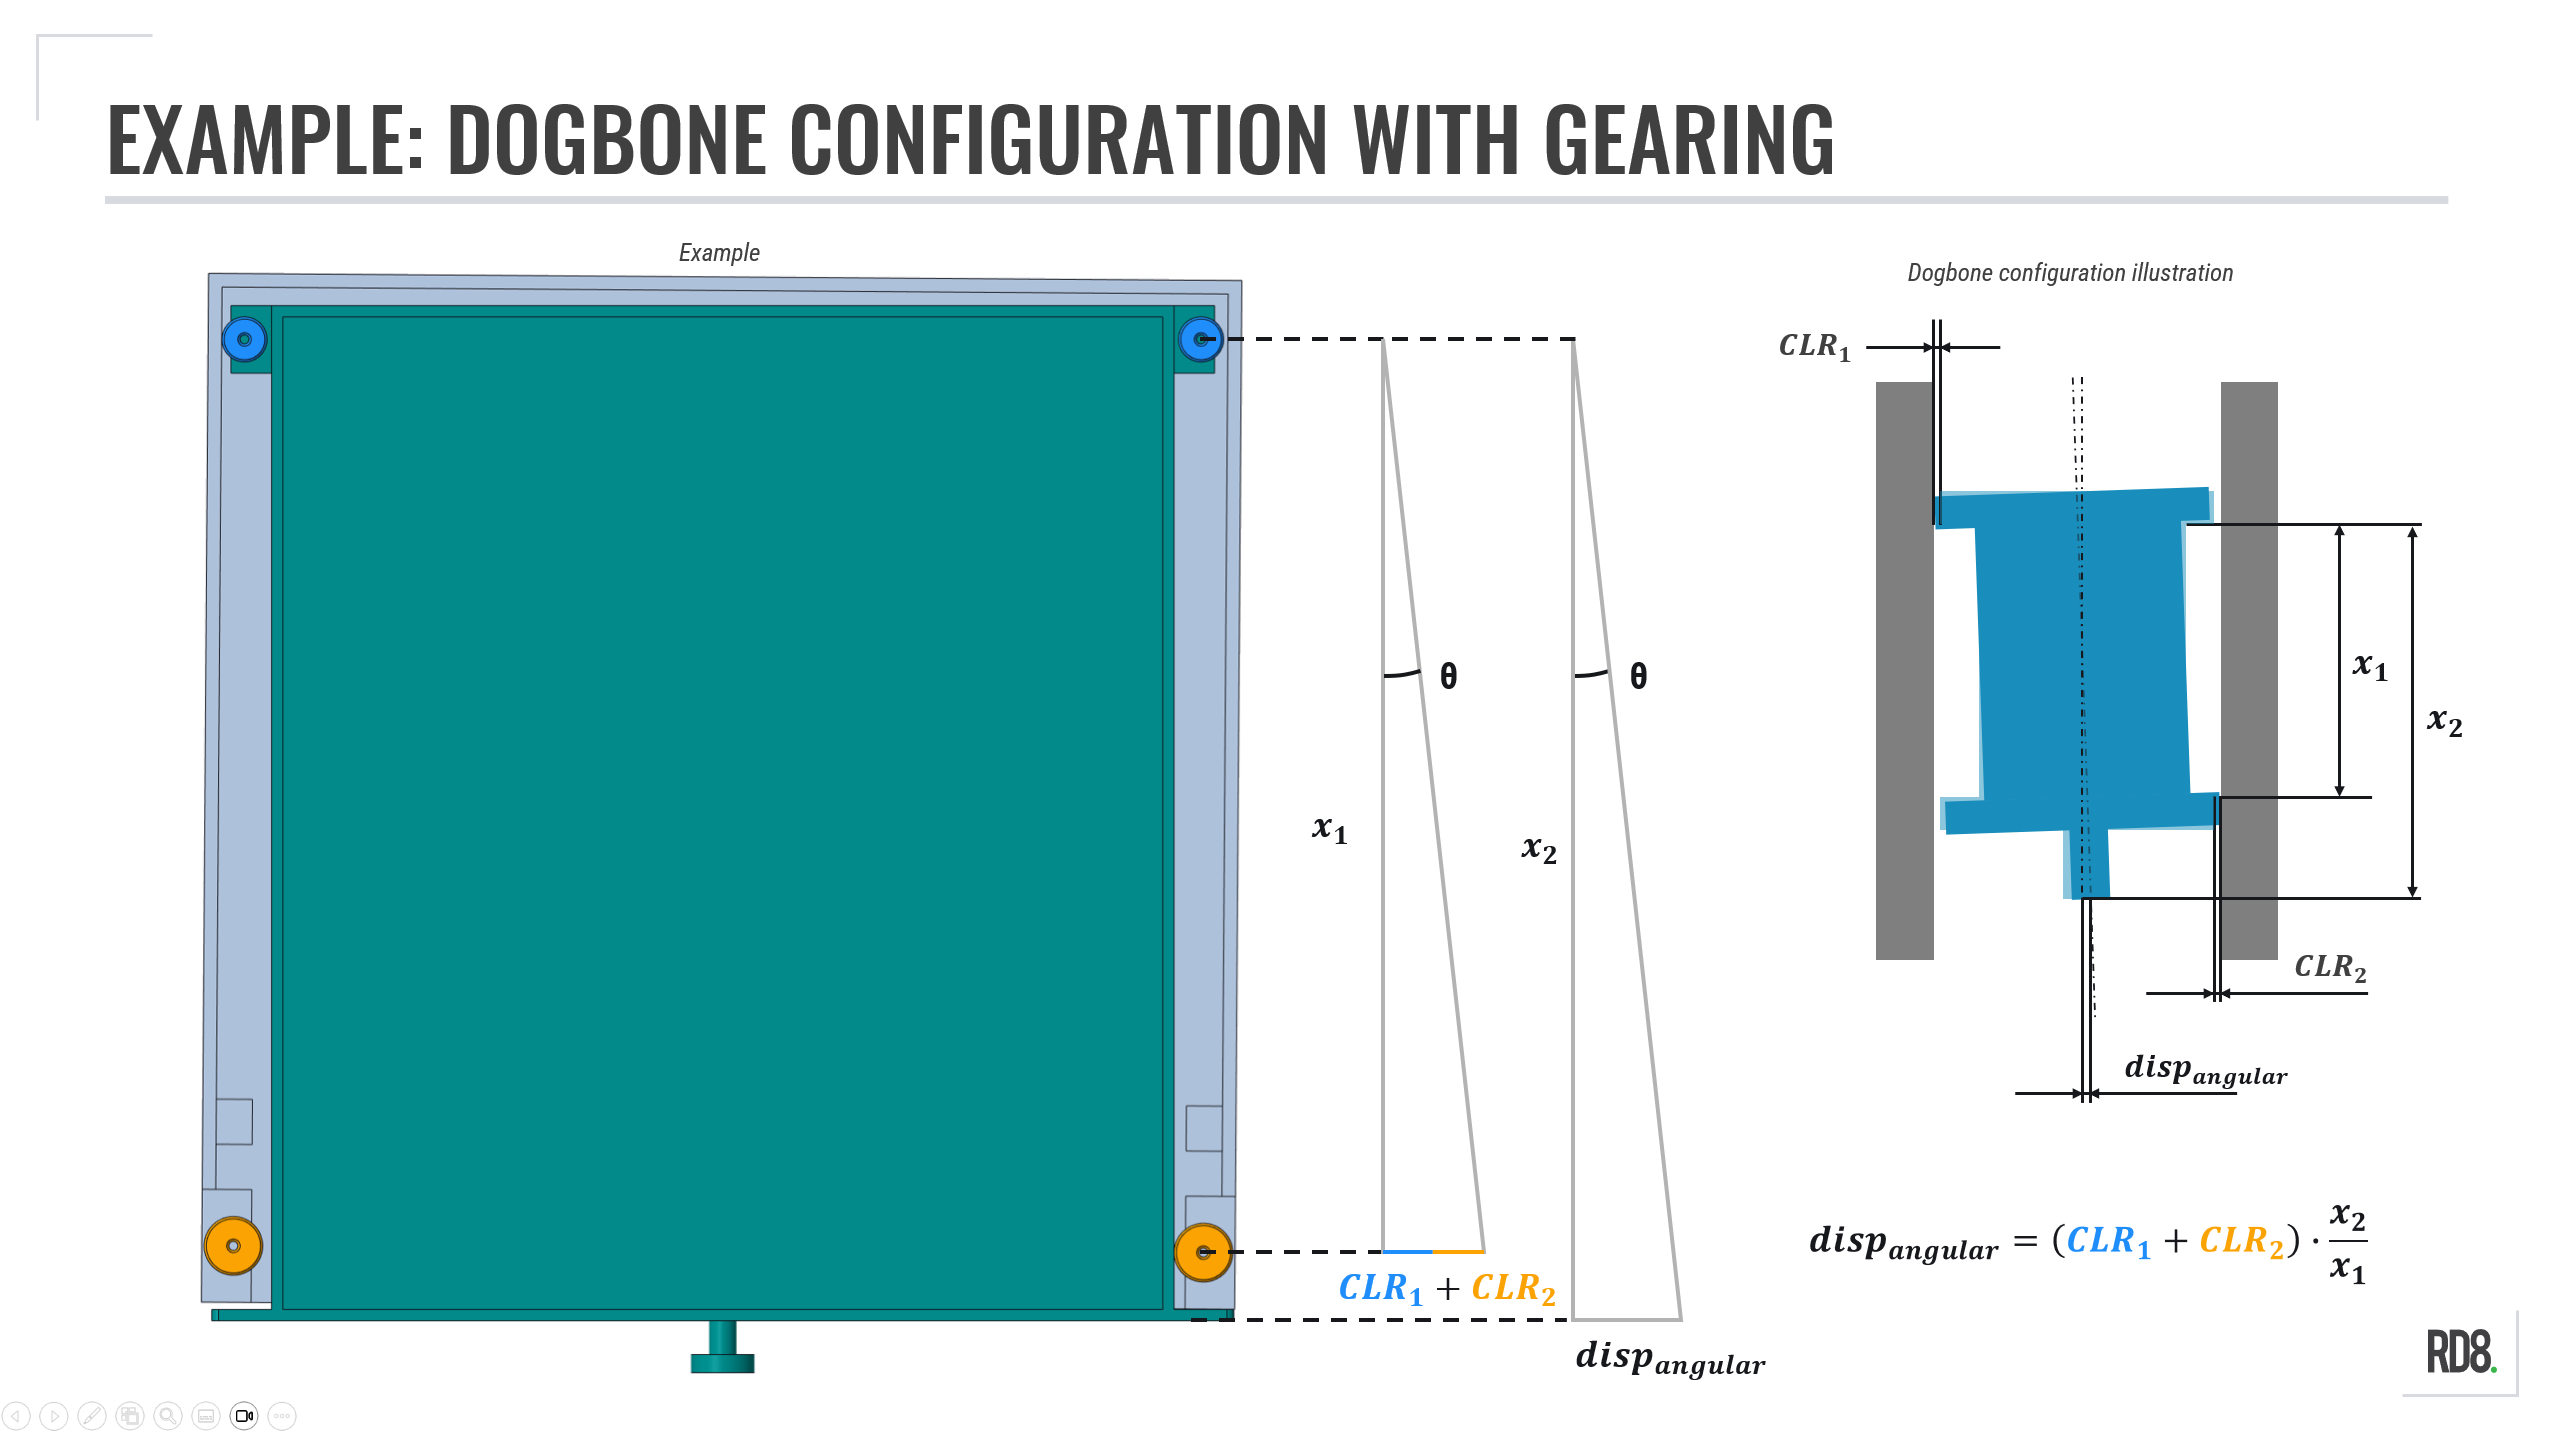
Dogbone with Gearing
The dogbone example is a matter of combining multiple fits; in this example CLR_1 and CLR_2, which are the fits between the front/back wheels and the frame.
This total clearance is multiplied by the ratio between the 'Point of Interest'-distance (x_2) and the distance between the dogbone features (x_1).
Hence, any clearance in the dogbone will experience gearing - resulting in an amplification in the 'Point of Interest'.
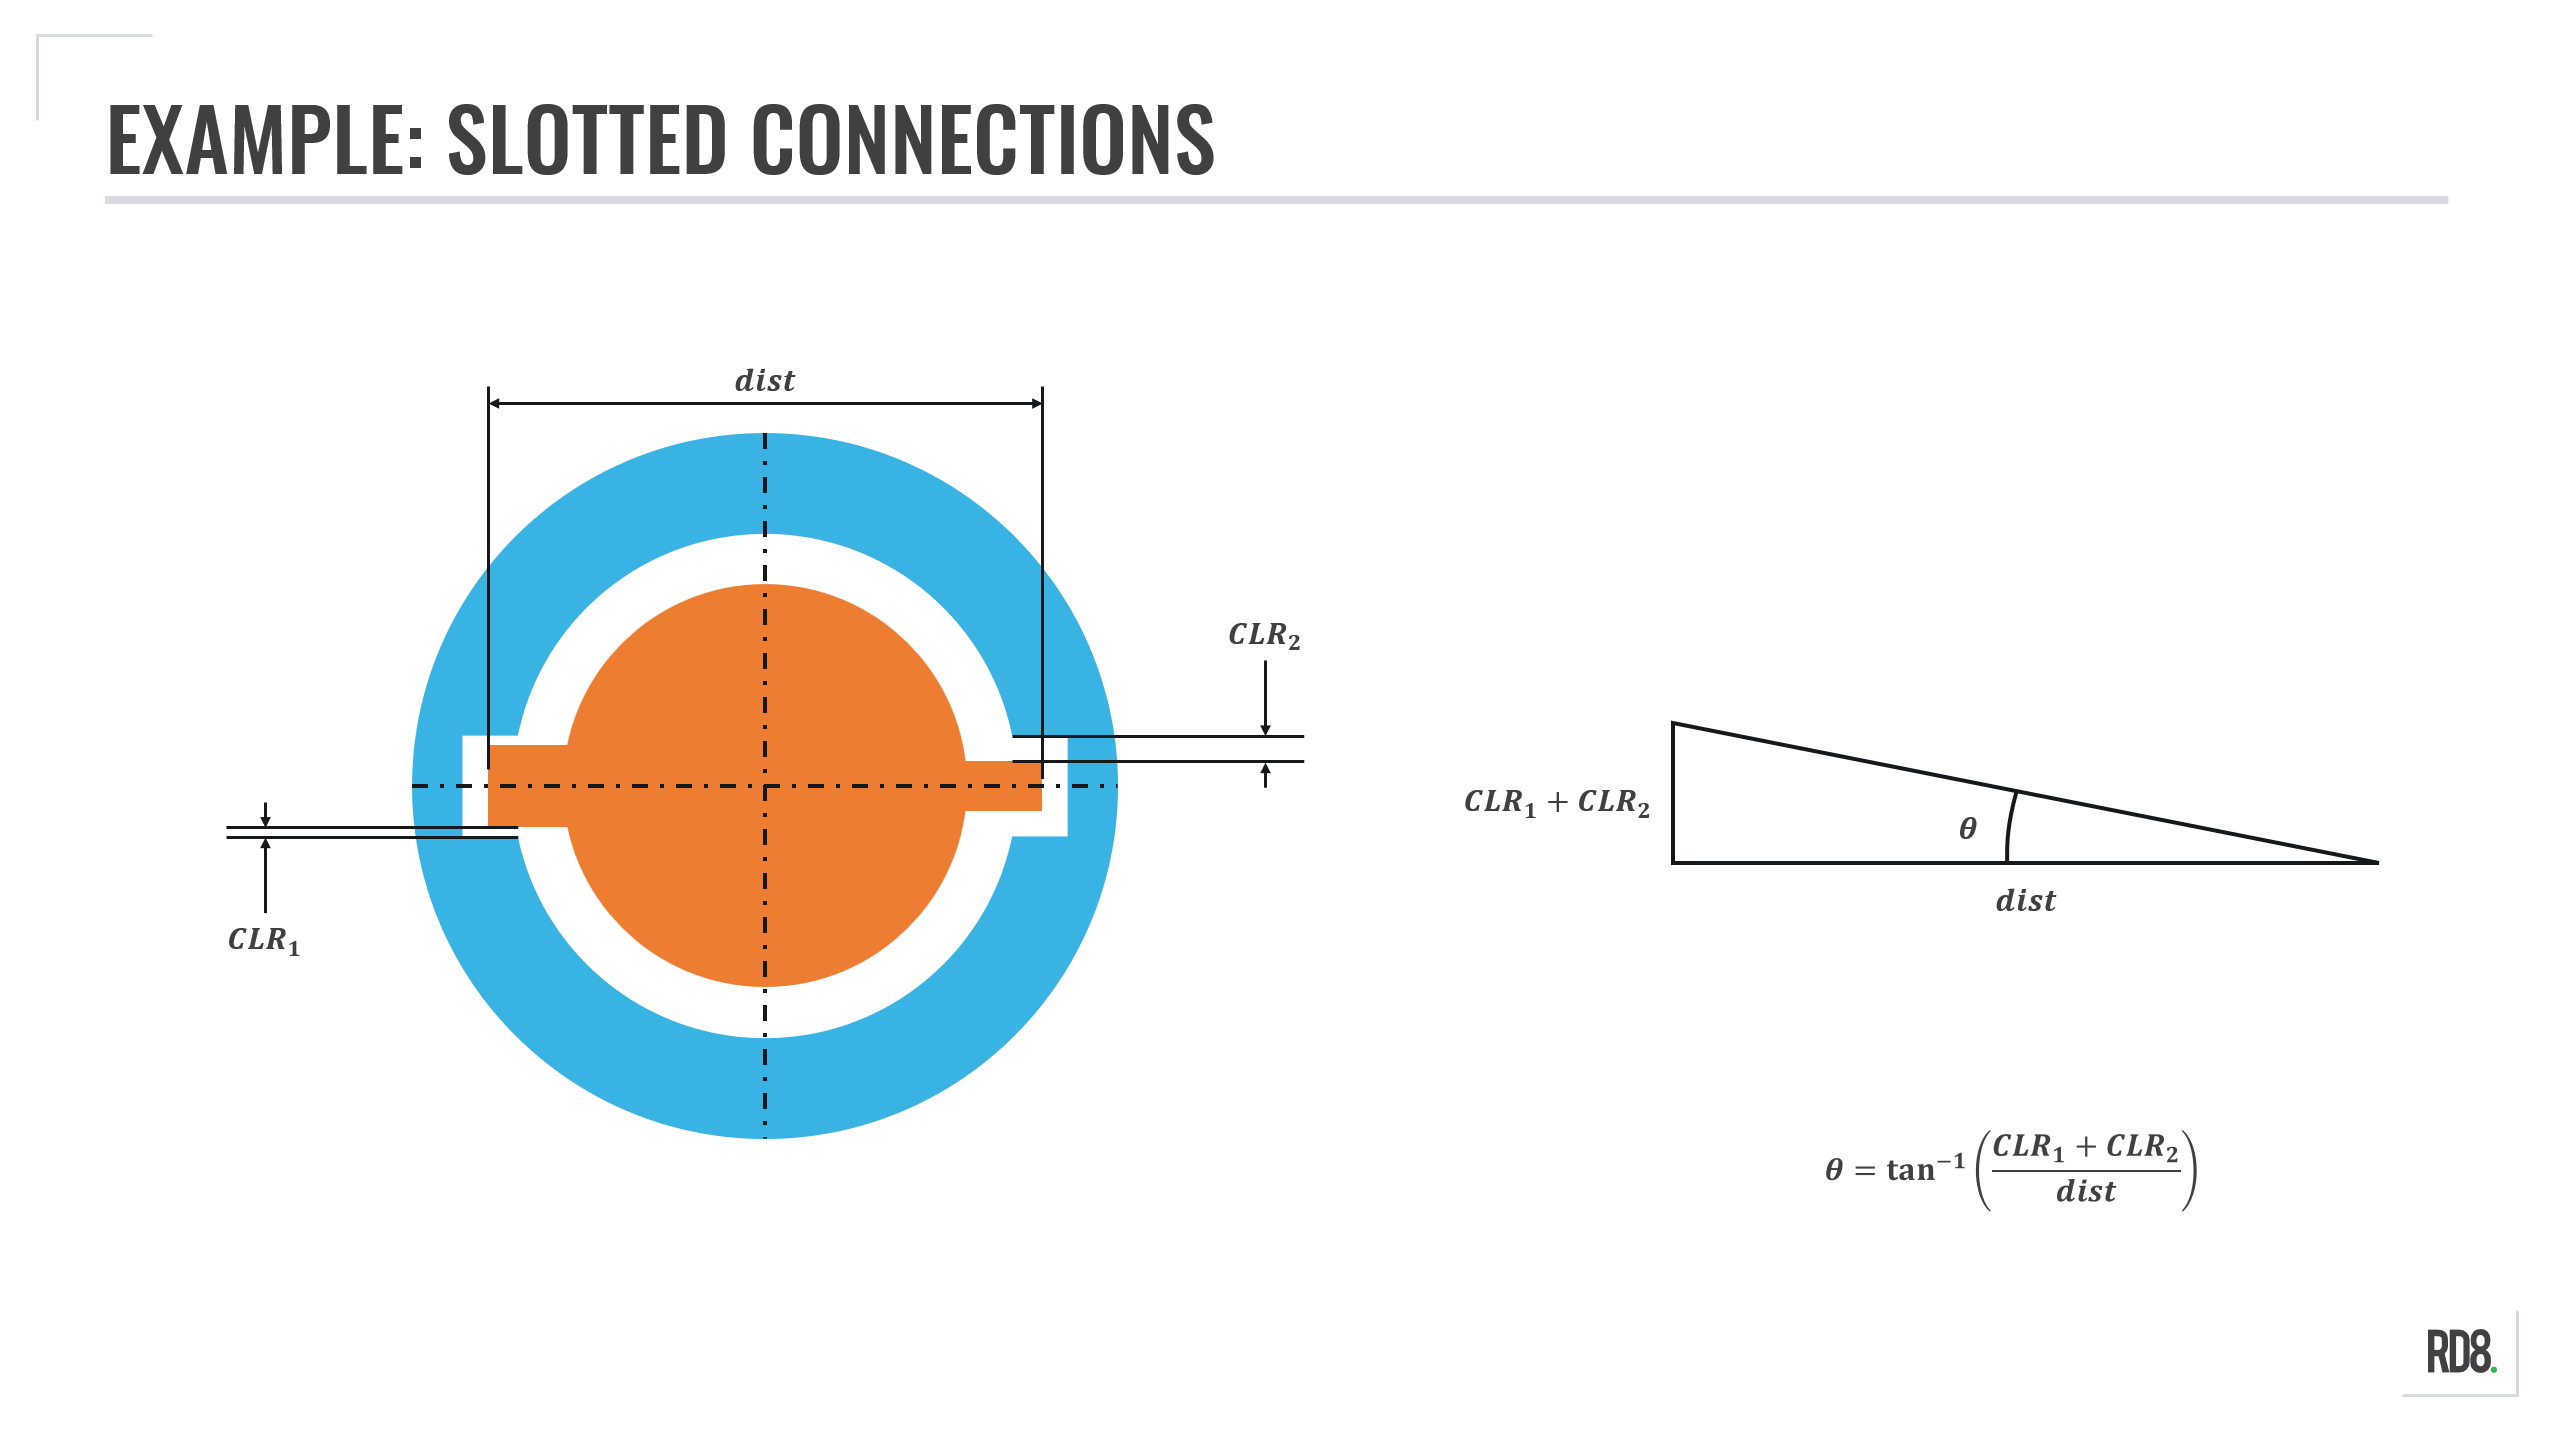
Example: Slotted Connections
The angular misalignment of a slotted connection is a matter of adding the clearances together (often of similar size) and divide it by the distance.
As with the dogbone configuration, this means the greater the distance the less sensitive your design with regards to angular contributions from fit clearances.
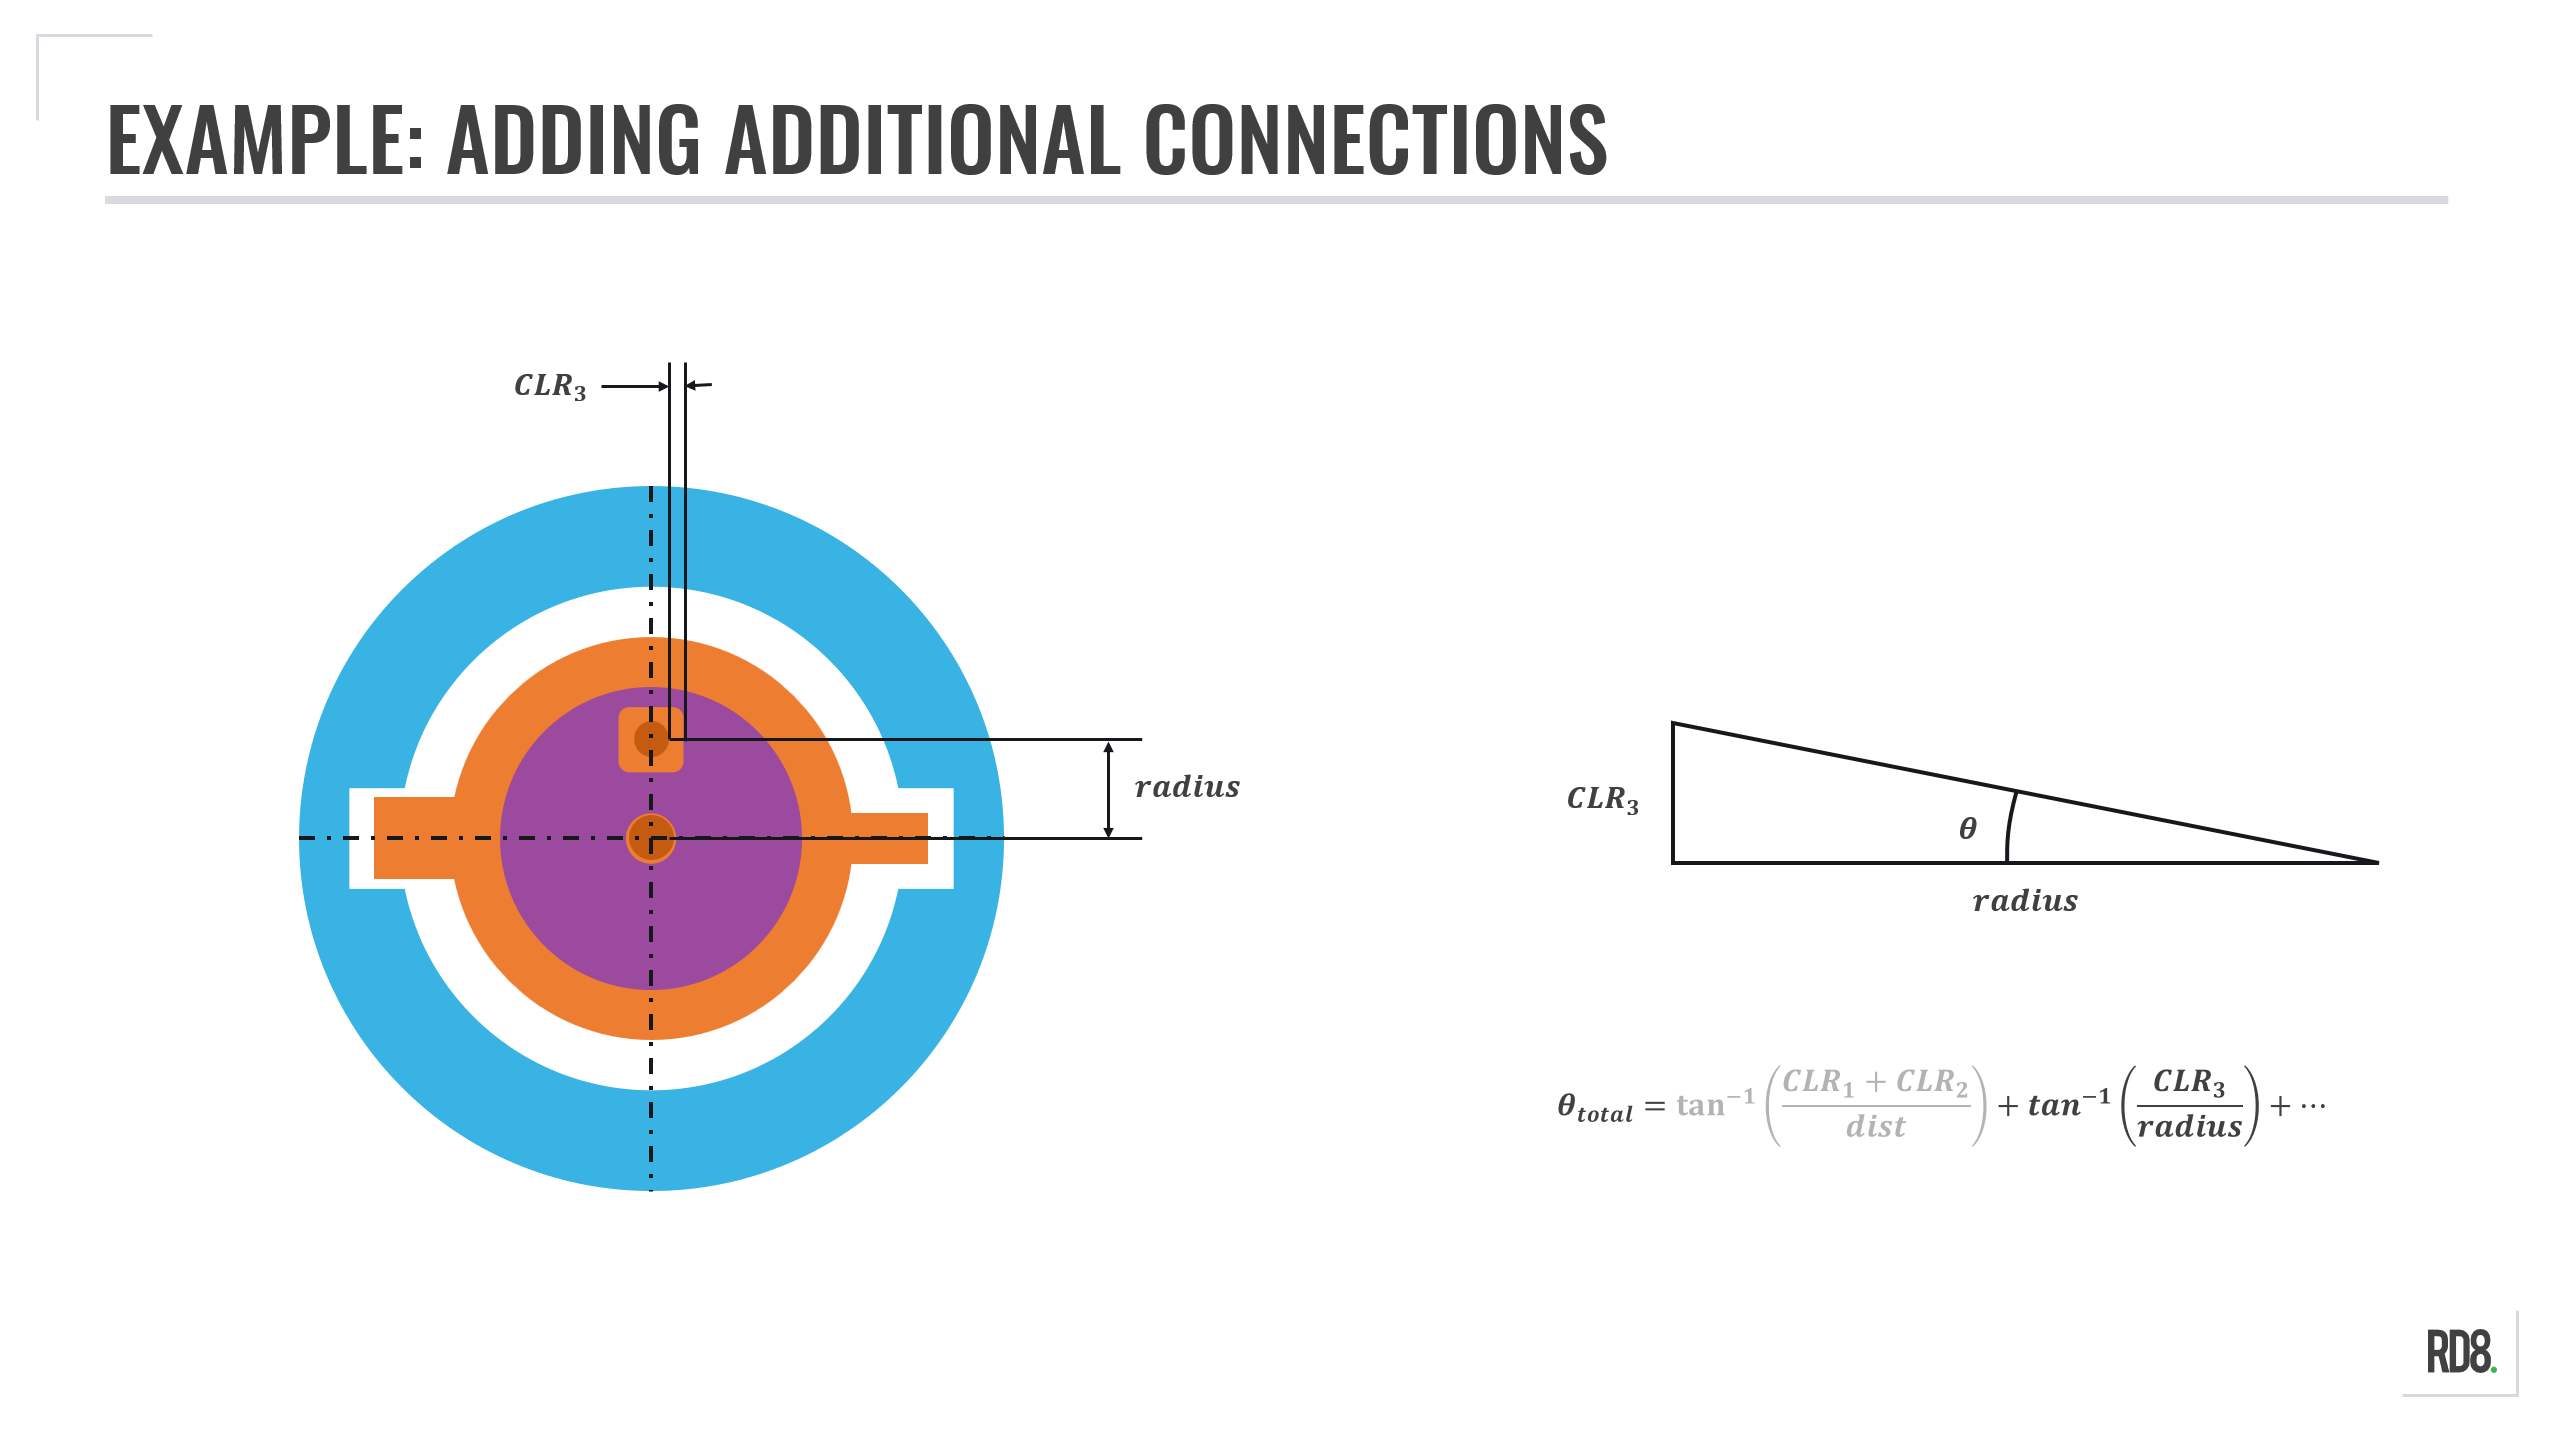
Example: Multiple Slotted Connections
Adding more parts to a tolerance stack is a matter of adding the angular contribution from the fit clearance at the given radius.
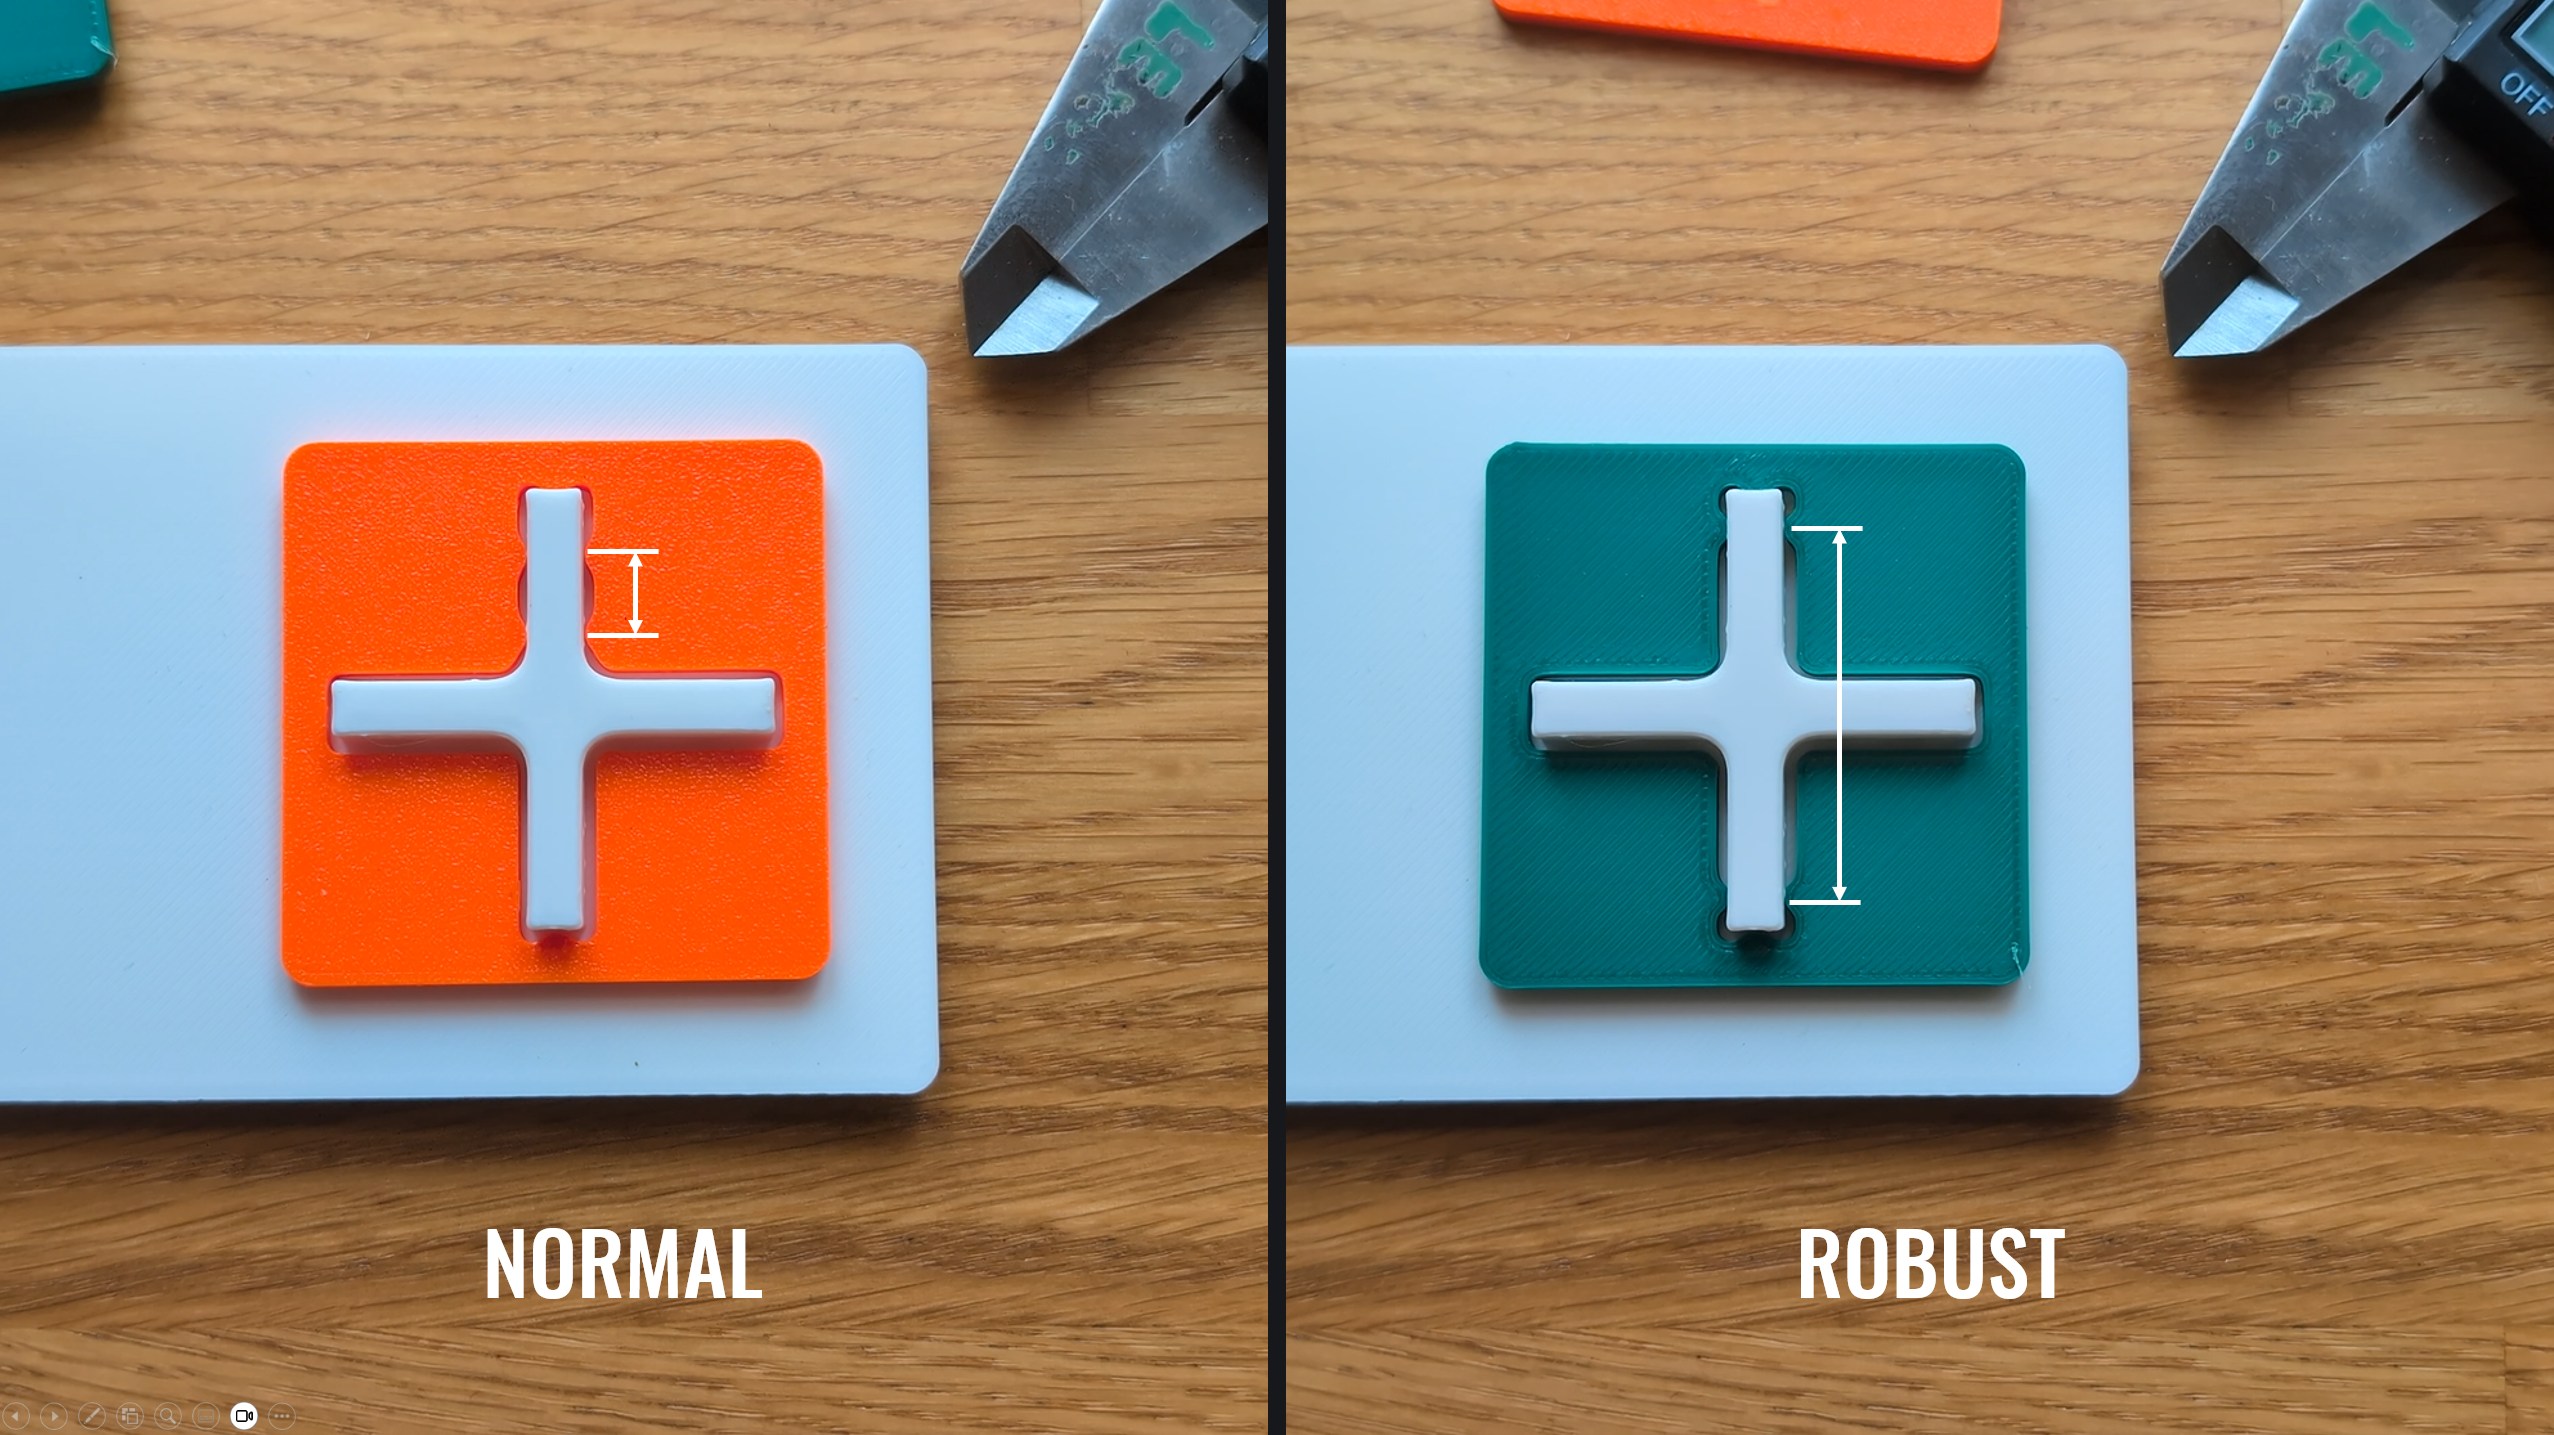
Best Practice: Increasing the Distance Between Rotational Locks
• Placing constraining features far apart = Robust Design: low angular sensitivity
• Placing constraining features with small distance = sensitive design: high angular sensitivity
Best Practice: Optimize to Simplify
Most designs can be simplified by making clear constraint features on all parts by use of Robust Design principles. In most cases this eliminates the need for 3D-stacks.
Optimization can be done with know-how from the RD8 Engineering Academy courses.
The RD8 Software can check if a design is optimized or if it can be simplified.
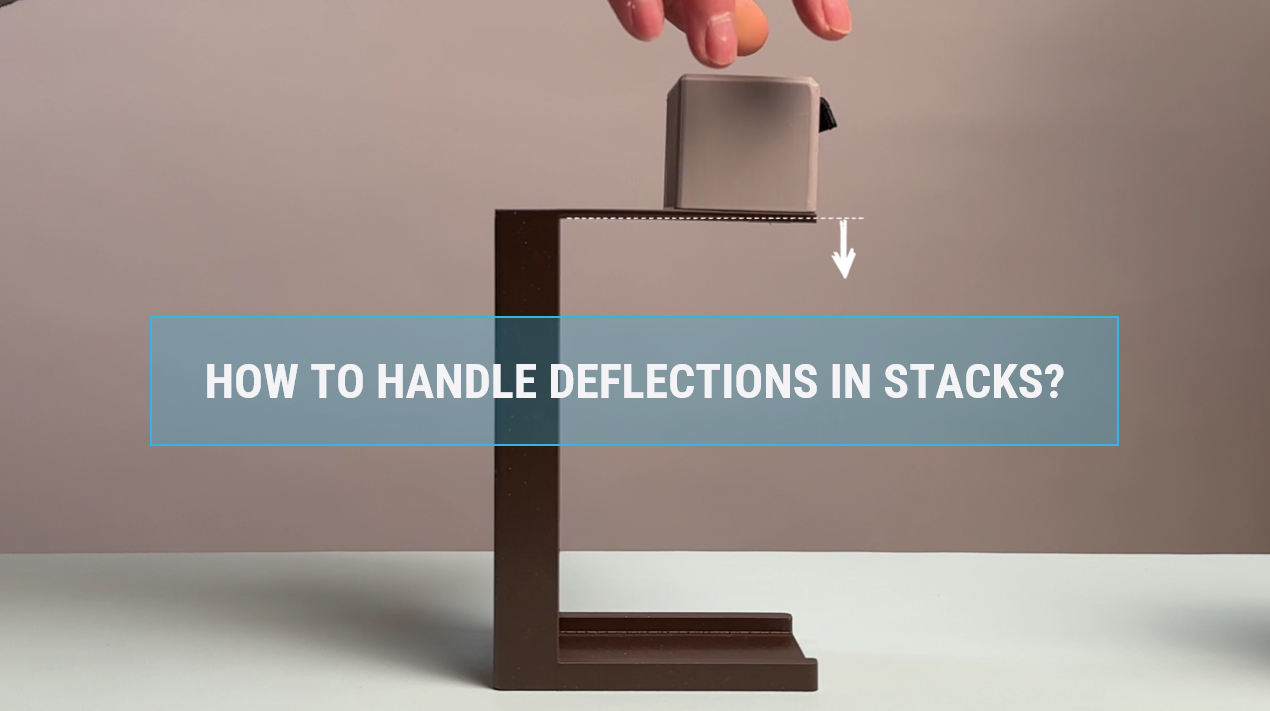
Including Forces and Deflections in your Stacks
An often missed point in tolerance analysis - is to neglect variation arising from applied loads to an assembly and the impact of these. Follow the best practices for how to include variation for applied loads in tolerance analysis.

Accounting for Deflections in Tolerance Stack-up Analysis
Don't let overlooked mechanical deflections compromise your design.
A minor deflection can be the tipping point between sufficient clearance and assembly failure.
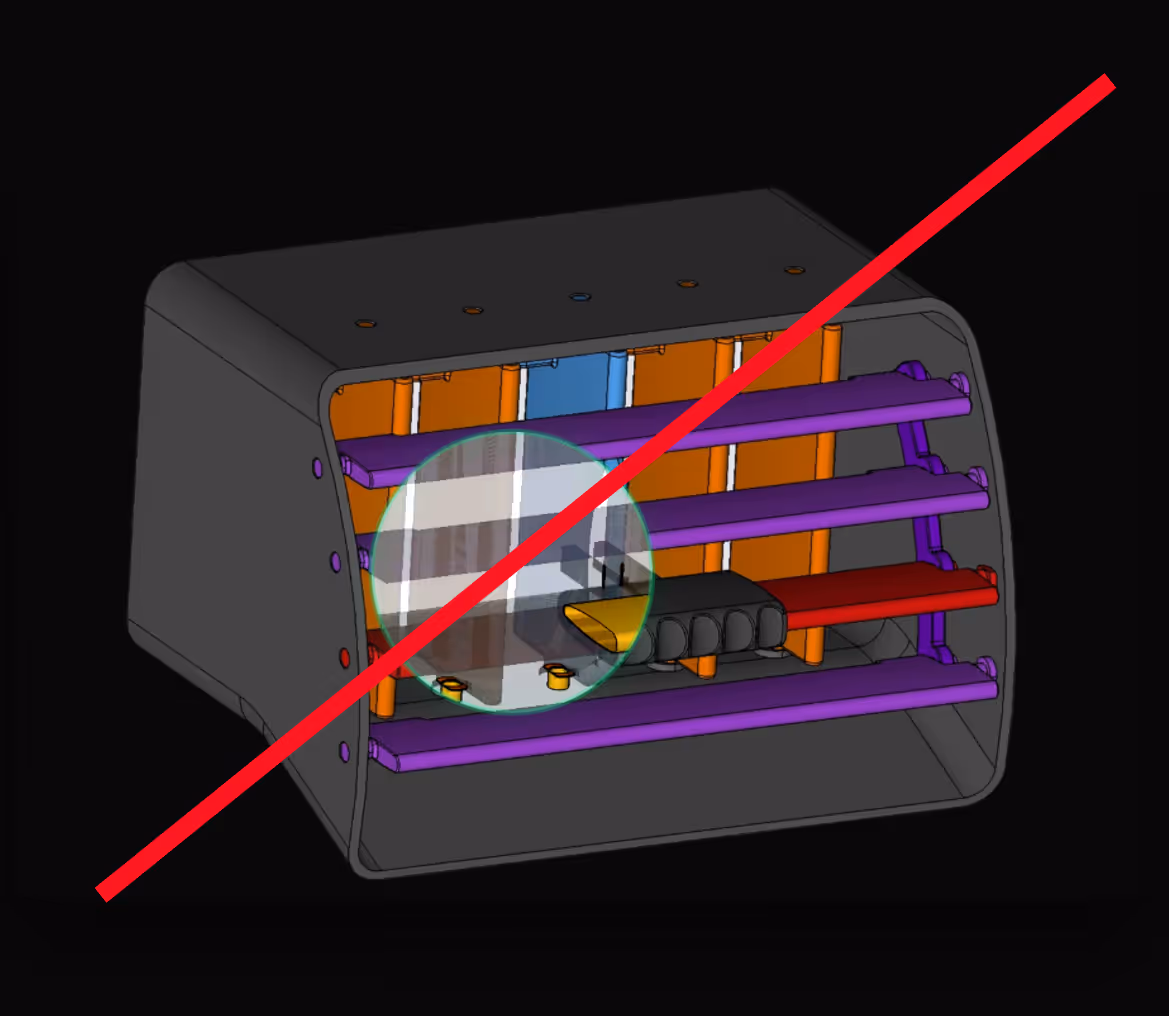
Identifying Critical Sources of Structural Deflection
Deflection occurs when forces act on a product, such as weight, force, user input, or acceleration.
Here, thet op part of the frame deflects under the weight of the top component.
Keep as much structural integrity in the parts as possible to ensure minimum impact of external forces. This is done by material selection, decoupling and placing moment of intertia optimal in the parts.
Make estimates by simple beam calculations.

Calculating Deflections Analytically
In many engineering scenarios, deflections can be calculated using idealized analytical expressions. Whether you are dealing with spring deformations or standard beam deflections, these formulas provide a fast, accurate way to account for structural deformations.
The analytical expression can be included directly in the tolerance stack.

Simulating Deflections with FEA
When deflections are too complex to calculate analytically, they can be simulated using Finite Element Analysis (FEA). Once simulated, the FEA results can be added to your tolerance calculation as a separate parameter.
How to Optimize a Tolerance Stacks by Design
Most engineers jump straight to tweak tolerances and negotiate with suppliers and/or manufacturing.
This video explores a different approach - a design approach - to optimize by placing constraints in optimal positions and apply Robust Design best practices.
The motivation is to reduce the variation by around ~80% and at the same time eliminating more than 50% of critical dimensions by design.
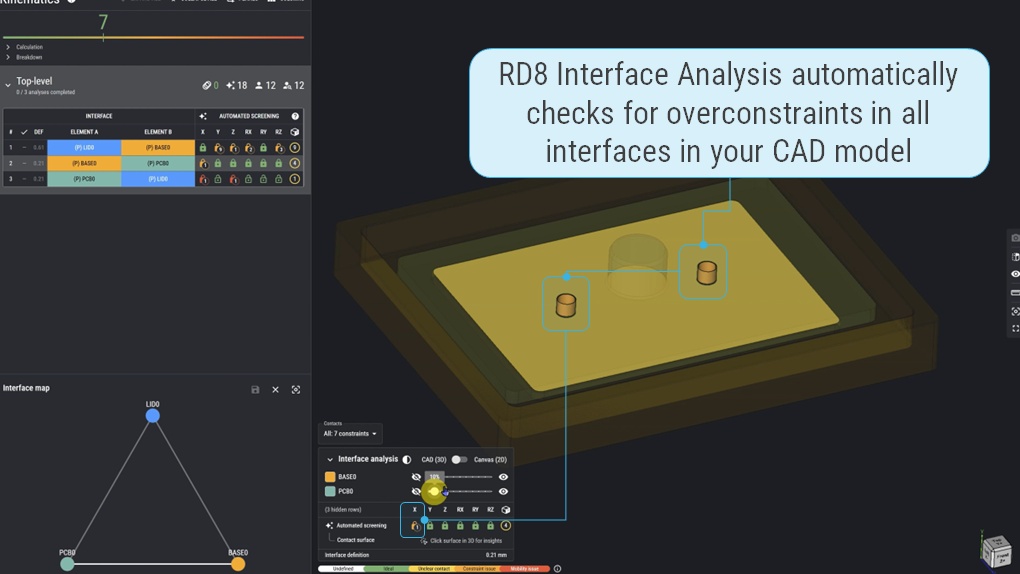
Principle 0: Check for overconstraints
- Perform interface analysis to check for overconstraints before calculating to ensure predictability of your calculations
- Mitigate / remove overconstraints before setting up a stack
- If overconstraints are present - you don't know which feature that will to the positioning and your assumptions will most likely be wrong.
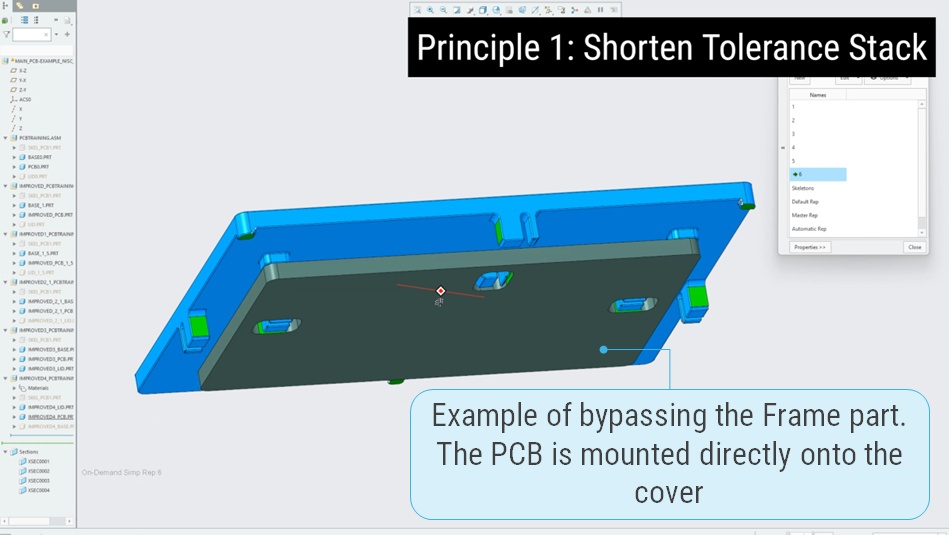
Principle 1: Shorten Tolerance Stacks
- Reduce the number of parts in the stack.
- Reduce the number of parameters in the stack.
- Short circuit stack by bypassing parts. E.g. instead of going through 5 parts - going through 3 parts is much better. In the PCB example; instead of placing the PCB to the Frame. Then the PCB can be placed directly onto the Cover to shorten the stack.
- Another example - for reducing the number of paramenters - is to place positioning features with shortest distance possible to the functionality/point of interest to eliminate parameters. Instead of using 2 positioning pins - 3 positioning pins can be used. By using a center pin to position in the X-direction - the a couple of parameters can be eliminated.
- Yet another example - aligning datum surfaces between parts on the 'same line' and use local compliant mechanisms to align on the common datum features eliminates even more parameters as the stack now does NOT rely on fits of the features but rather on the placement of the datum feature. The flexible features ensure that the fit does not matter as play is eliminated and that the parts are always 'pushed' to the datum feature. By this trick a fit of 2 parameters can be eliminated.
Principle 2. Maximize Distances
Maximize distances of positioning features to gain angular position.
In the example - the positioning features in the PCB and the Frame are spaced as far from each other possible.
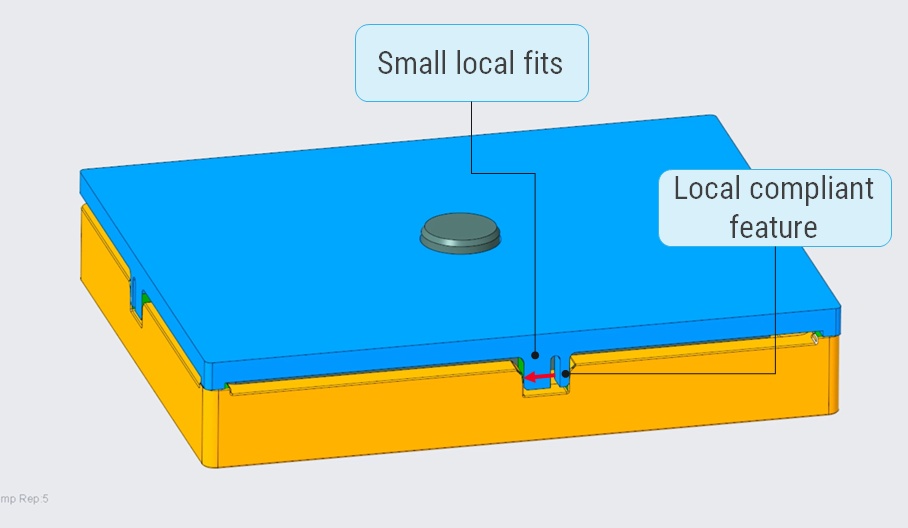
Principle 3. Optimize Fits.
- Use small local fits.
- Remove play.
- In the example instead of using features that span across the whole cover - small local fits (features) are used to position.
- At the same time - local compliant features - small spring like geometry - takes up clearances and pushes the Cover up the positioning datum surface on the Frame.
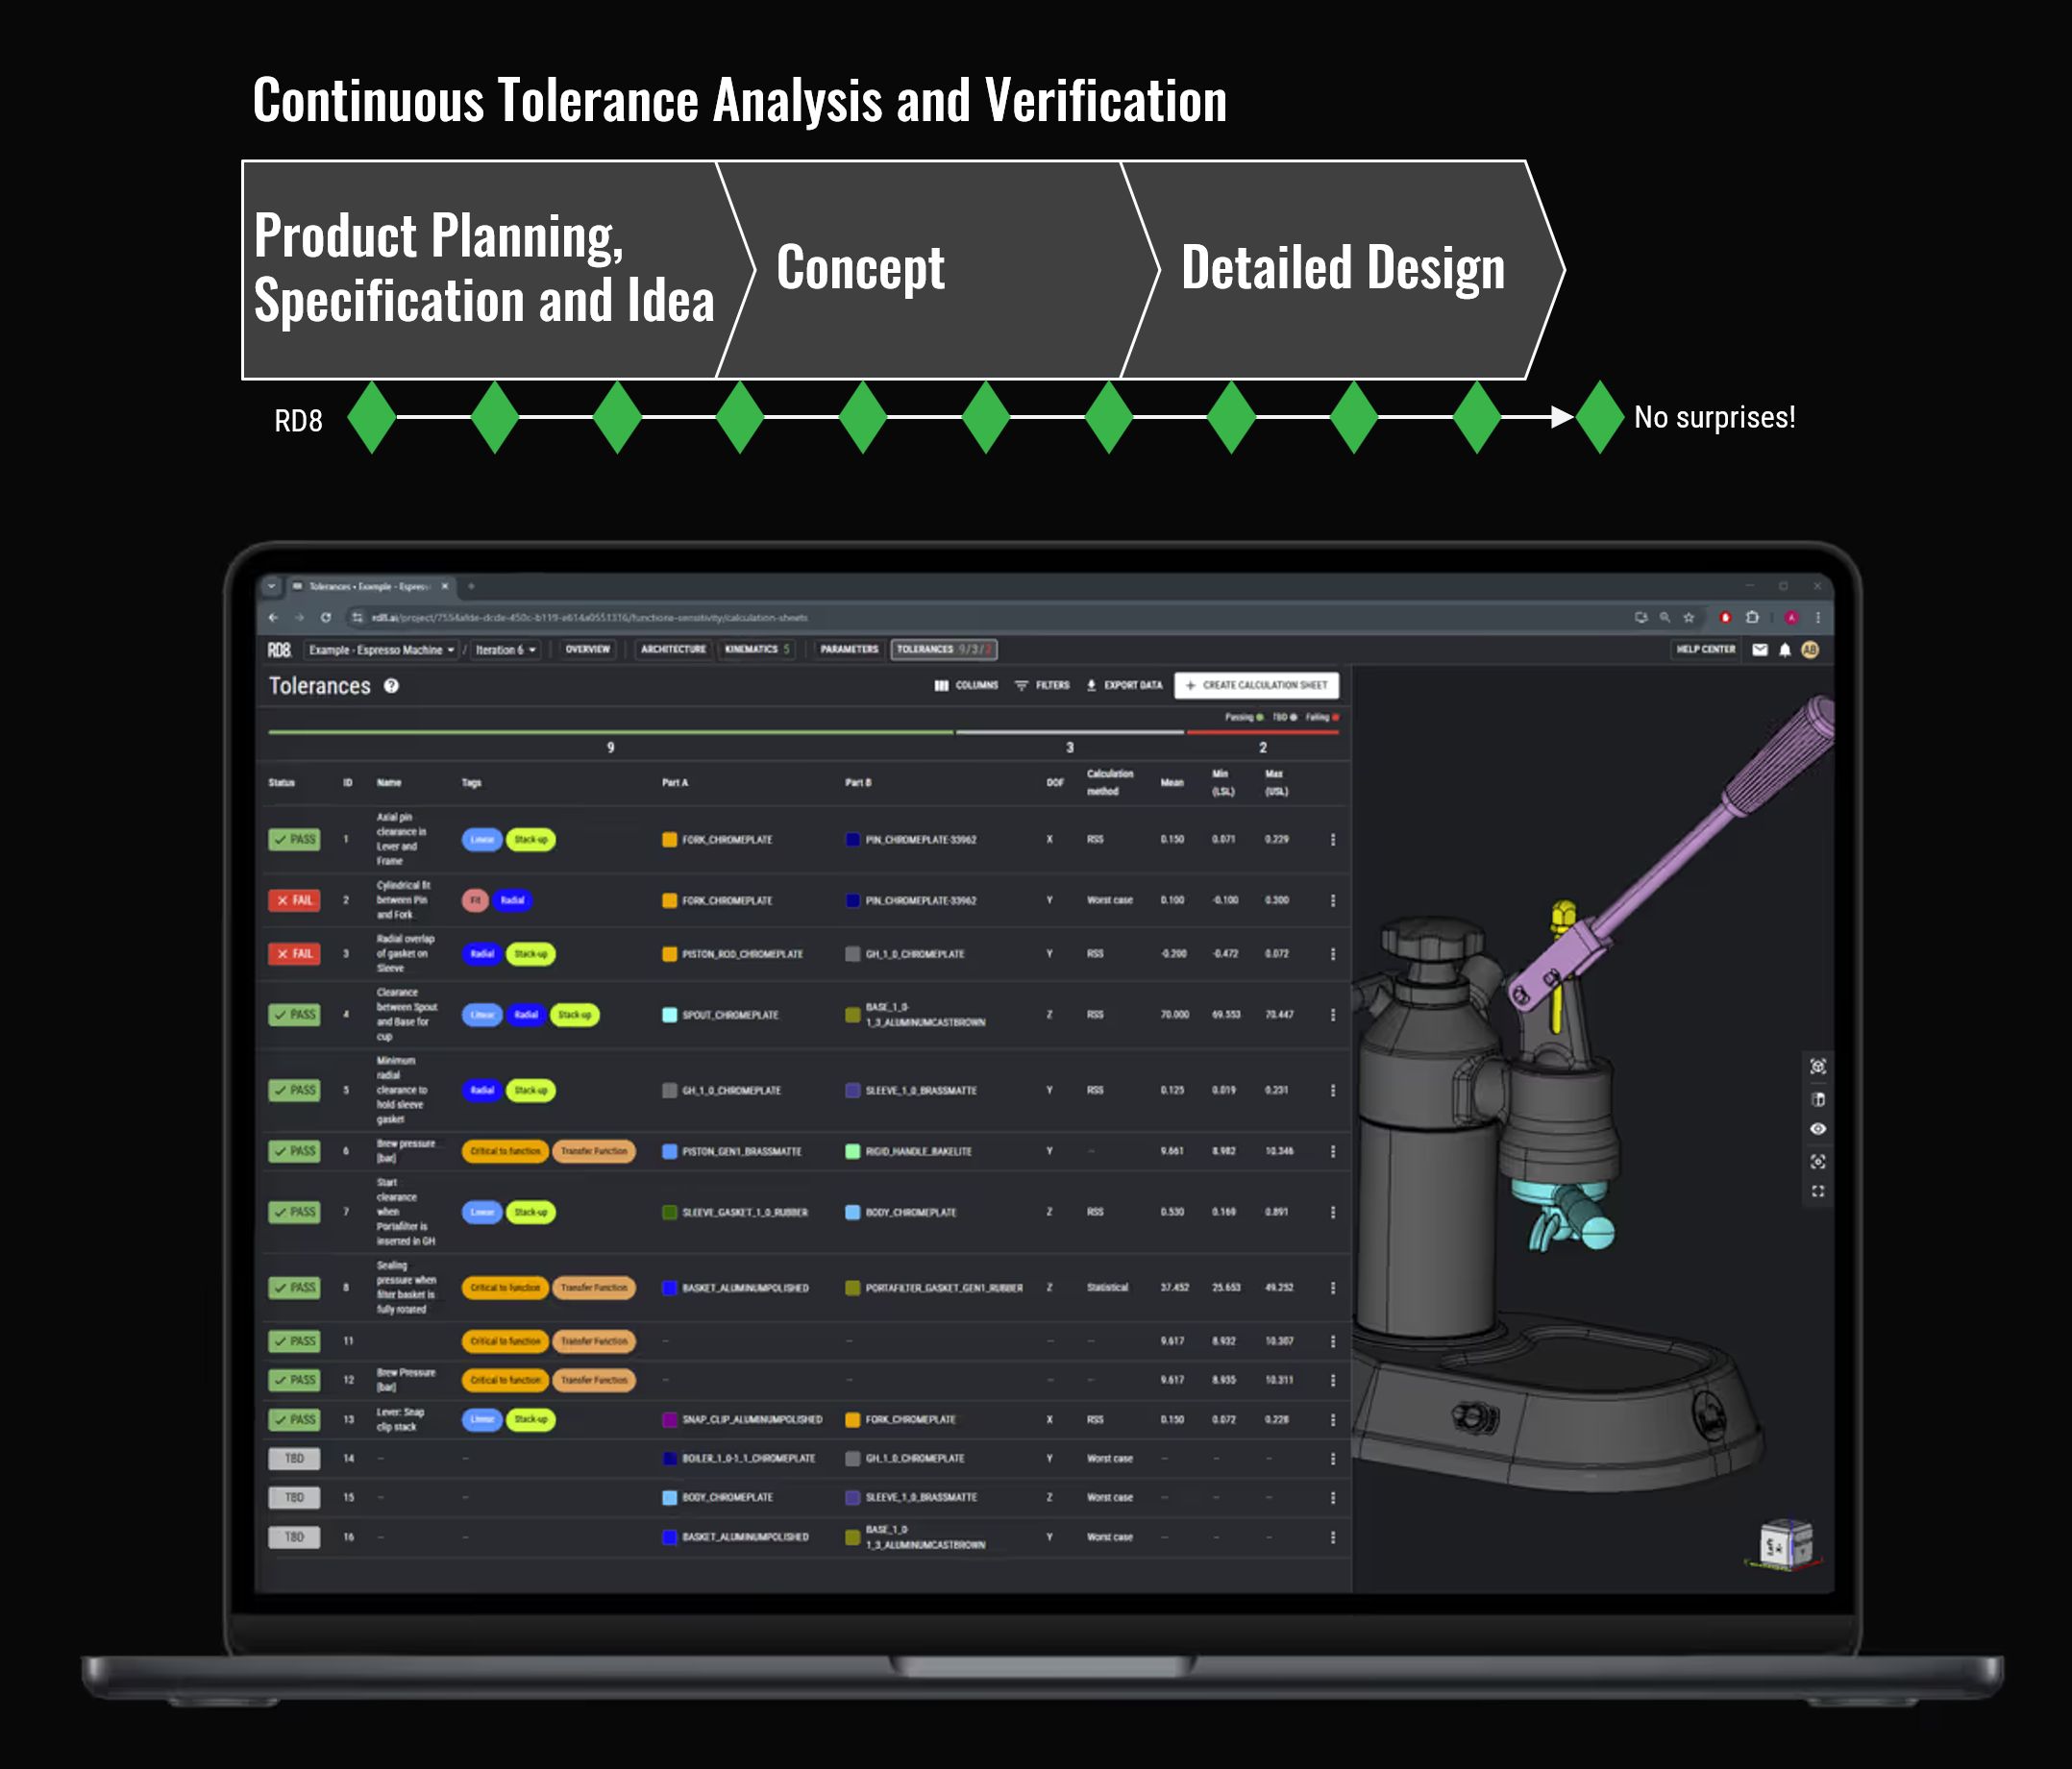
Run this PROCESS in RD8
Instead of relying on gut feeling or Excel-based stack-ups, RD8 gives your team a modern, visual, and collaborative piece of software to manage variation. Whether you're designing precision mechanisms or high-volume components, we help you brings clarity to complex assemblies - and avoid costly rework, ensure functionality, and speed up development cycles.
What Are the Common Challenges in Tolerance Stack-Up Analysis
Avoiding common tolerance stack-up analysis mistakes improves product reliability and reduces costly rework.
Wrong tolerance path
Leads to - incorrect results and unpredictable product behavior.
Avoid it - by identifying the correct tolerance path. The RD8 path finder feature automatically detects and set up the path for the user.
Conflicting tolerance path
Leads to - unpredictable results (only right in some samples).
Avoid it - by checking for design clarity and overconstraints in the design prior to set up of the stack. The RD8 path finder feature automatically checks for possible paths to ensure that tolerance stack is unambigious.
Too tight and too many tolerances:
Leads to - high part cost, difficult sourcing and quality control.
Avoid it - simplify the tolerance stack by design to loosen tolerances. The RD8 Optimization feature helps with just that.
Wrong tolerance allocation:
Leads to - unnecessary high part cost or assembly malfunction.
Avoid it - know you process capabilities and assign tolerances accordingly. The RD8 tolerance allocation function that is based on "ISO 286" and automatically looks up the suited tolerance based on the given process capability (IT grade).
Tolerances that is out of date
Leads to - assembly and functional product errors.
Avoid it - by keeping the 3D model, tolerance stack-up calcualtions and 2D drawing documentation in sync. RD8's parameter list gives an up-to-date overview of dimensions and tolerances that should go onto the 2D drawing.
Last minute changes
Leads to - functional failures if details are overlooked.
Avoid it - check all calculations after a change. The RD8 system is based on a global parameter list and the user can simulate effect of changes to all calculations before a change is rolled out.
Poor specifications
Leads to - that product design does not meet the user needs.
Avoid it - by (systematically) breaking down the user needs to a functional requirement. See the RD8 Critical-to-Quality approach.
Stacks are not done
Leads to - random 2D drawings without any reasoning for specifications resulting in failing product functions.
Avoid it - by setting up calculations/stacks for all critical functions. This is often skipped if it too complex to break down the function to a calculation or if it is too time consuming to set up an analysis. The RD8 system is made for quick analysis and easy set up.
Too late stack-up calculations
Leads to - need for unesssary strict toelrances (and the downstream effects hereof).
Avoid it - by making pre-CAD estimates to layout the product functions and tolerances stacks to define the most robust concept design possible (before it is too late to change anything). The RD8 system can be used up-front -before a CAD model is present - to estimate and layout optimal stacks.
Using too many GD&T modifiers
Leads to - ultra high part cost.
Avoid it - by being in control of the design. The RD8 Optimization feature augments to break down complex 3D-problems to simple 1D- or 2D-stacks.
Important dimensions are not marked on the 2D drawings
Leads to - unpredictable product functionality.
Avoid it - by taking all the elements from the tolerance stack analysis and mark them on the 2D drawings as inspection measures. Depending on criticality of the inspection measures the IPC (In Process Control) strategy can be defined.
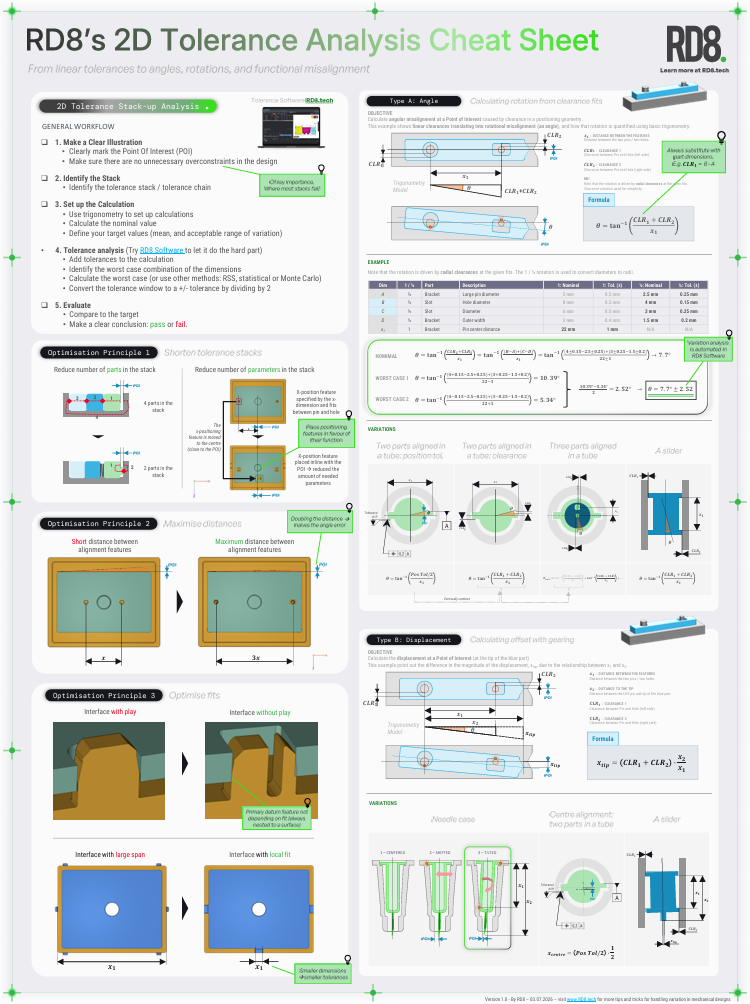
Download the RD8 1D and 2D Tolerance Stack-Up Cheat Sheets
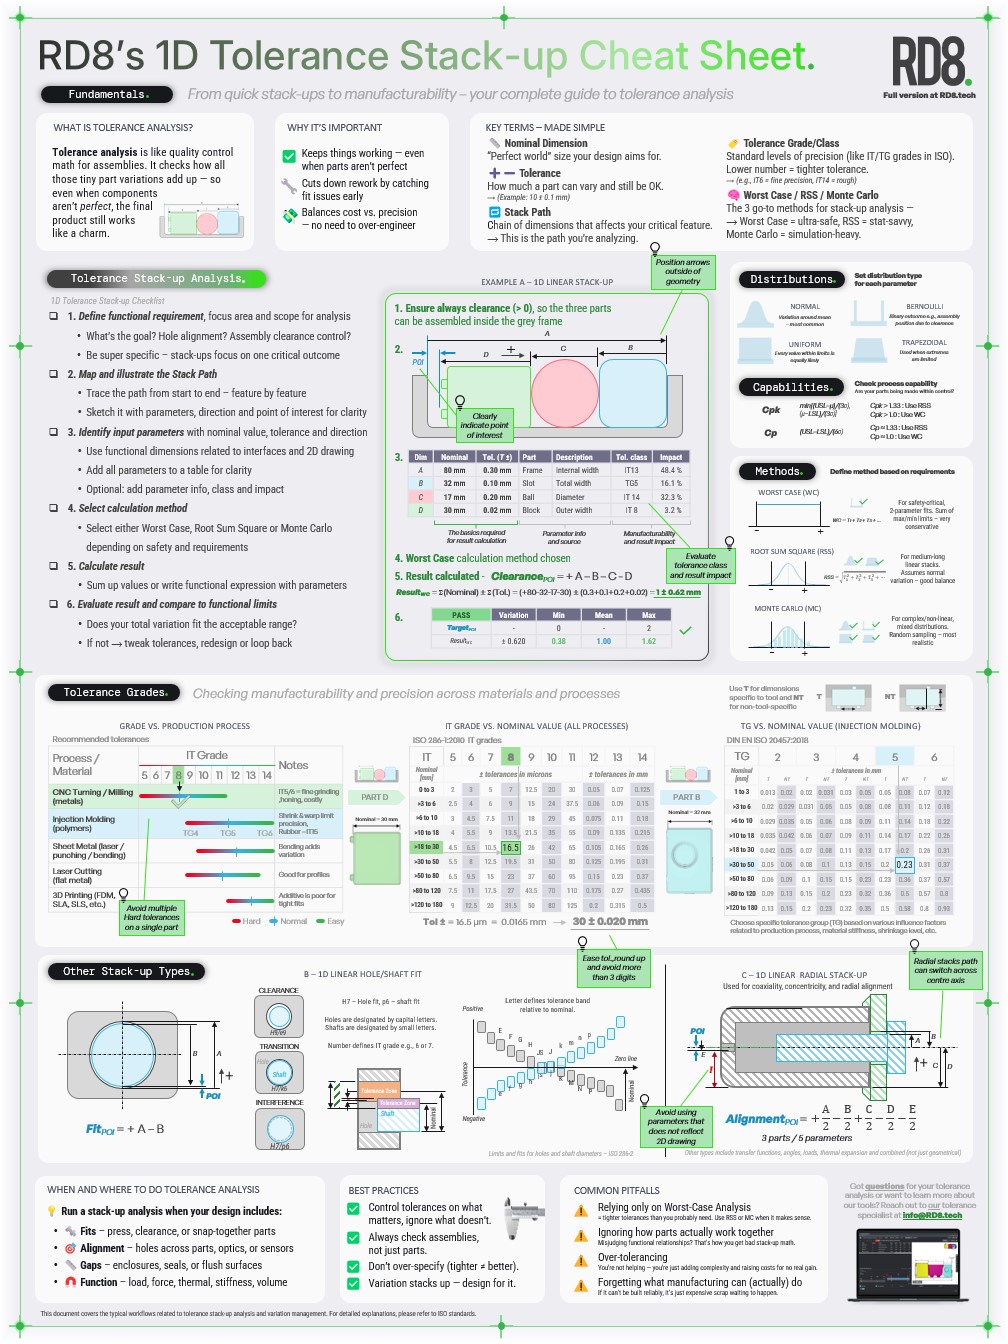
1D and 2D Tolerance Stack-Up Cheat Sheets
Download our popular Cheat Sheets for free. Print it, hang it on the wall, and master the basics of 1D and 2D tolerance stacks with quick references.
How Does GD&T Affect Tolerance Stack-Up Analysis
GD&T modifiers adds more accuracy to your tolerance analysis - in the essence that the GD&T language gives an unambiguous way of communicating designs.
All types of geometric tolerances impact stack-up results if they are included.
GD&T is important to include - if they are a part of the 2D documentation - they should also be a part of the analysis. It is important that analysis and manufacturing conditions are synced.
For initial calculations GD&T contributions can be allocated on a ball park level - then later tweak with real production expecations.
GD&T modifiers can be used to improve accuracy if they are used wisely. Otherwise they can be a costly affair.
Sometimes they are used as the 'easy but costly tool' to reduce variation. The better way is to simplify the design to reduce the need for GD&T modifiers.
The RD8 Engineering Academy teaches these principles.
The RD8 Software identifies optimization potentials automatically from your CAD model.


What is the difference between tolerance stack-up analysis and tolerance analysis?
Most engineers will not distinguish between tolerance stack-up analysis and tolerance analysis.
Tolerance analysis is in essence a broader concept that takes multiple parameters into account - e.g. a mix of dimensions; mm, forces, torque, time, etc.
Someone in working in finance can work with tolerance analysis and Monte Carlo simulations is actually used a lot in that field as well.
Whereas tolerance stack-up analysis specifically examines how tolerances accumulate along a series of dimensions in an assembly. So typically limited by spatial units such as millimeters, inches, degrees that describes distances, angles and form of physical objects.
In mechanical engineering tolerance analysis is typically used to convert results from tolerance stack-ups to functional requirements such as sealing pressures, reaction forces, needed torque, etc.
Mechanical engineers would use the tolerance stack-up to master the geometry and spatial behavior of the product design.
To translate the spatial behavior into product functions or functional requirements these would often be translated or exalted to tolerance analysis where they would be related to a user input or user need such as input force, needed torque, lost effiency, noise, lifetime, wear, etc.
What are the practical applications of tolerance Stack-up analysis
Automotive
To ensure performance in various conditions.
To ensure minimal part cost in a competitive landscape.
To maximize the user need with the lowest cost - to maximize profit.
Life Science
To ensure functionality - always.
Ensuring that close to 100% of devices always work (in harsh conditions) with intended performance (e.g. dosing accuracy)
Consumer Products
To balance functionality, durability and cost.
Maximizing value to the customer at the lowest production cost.
Bring new innovation to the market, frequently, with no delays.

What Are the Best Practices to Optimize Tolerance Stack-Up Analysis?
The best practices are simple - but hard to master in practice. The RD8 Engineering Academy offer courses to master tolerance optimization by design.
- Optimize the constraint-set (typically the tricks is to move positioning features as far away from each other as possible)
- Eliminate play (by incorporating local compliant features)
- Shorten the stack (bypass parts to make the stack shorter)
What Are The Benefits of Doing Tolerance Stack-Up Analysis Early
The benefits doing tolerance analysis early in the development phase is that it requires you to make a lot of important decisions that could often have been postponed with the result of unpleasant surprises.
Examples of benefits:
- Aligning on production capabilities to make a design that is fit for production (and not the other way around)
- Optimizing and simplifying designs before it is too hard to clean up
- Knowing what you are doing. Tolerance analysis forces you to describe product behaior by math and physics. Truly understanding these will save a lot of iterations (time and money) and yield a better product functionality - all in all - better quality to the customer
What is a Tolerance Stack-Up Analysis Software?
Software is used to go beyond excel spreadsheets to:
- Reduce manual errors
- Manage large data sets
- Run Monte Carlo simulations
- Keep track of versioning
- Collaborate seamless
- Look-up tolerances
- Streamline workflows and quality of analysis
- Make documentation of results and assumptions
- Speed up the design process
RD8 stands out as a tool that:
- Provides full overview of multiples stacks and relations.
- Can be used from the early design state
- Can be used through the design process and easily syncs with the 3D CAD model
- Work with 1D-, 2D-, 3D-, unlinear-calculations (can do Worst Case, RSS, Statistical and fast Monte Carlo Simulations).
- Does automatic tolerance stack-up detection and setup.
- Has a unique optimization feature - automatic identification and highlight of overconstraints. Checks DOFs in 3D.
- Is fast and easy to use

Try The Napkin tools
Contact and Clearance Calculator

Snap Fit Calculators
Ensure your design is feasible before you model.
Spring Calculator
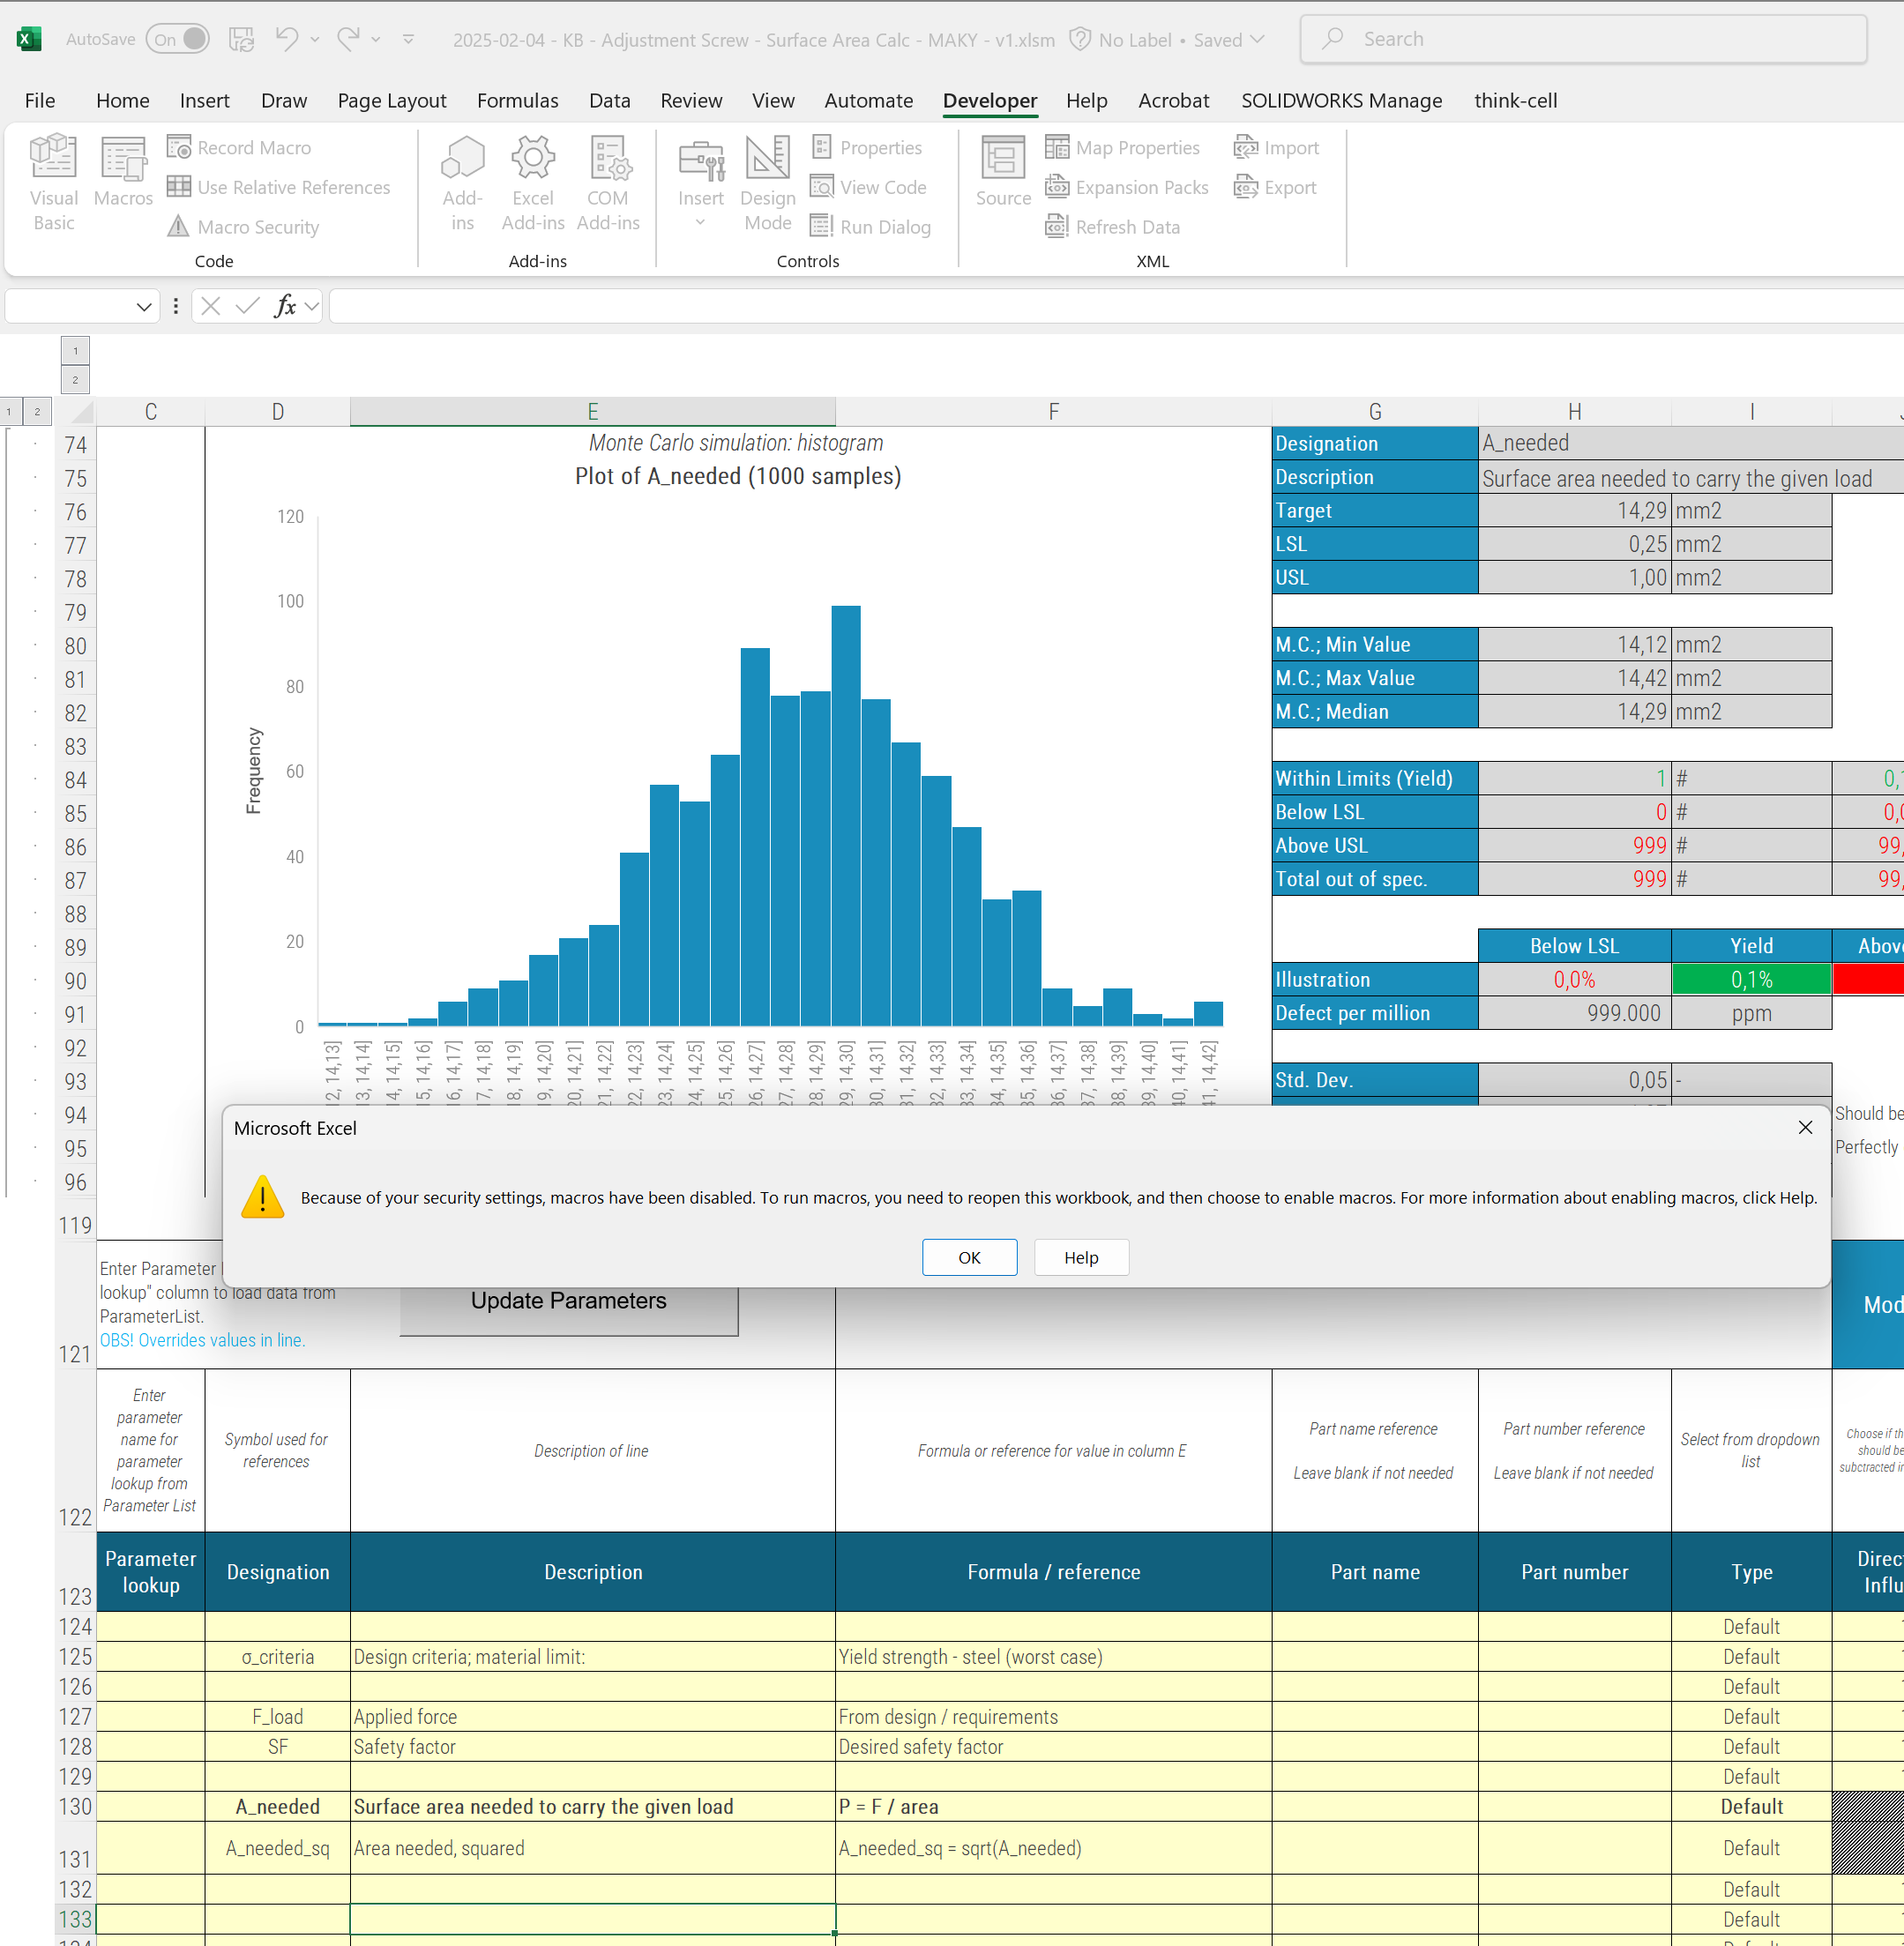
Can You Do Tolerance Stack-Up Analysis in Excel?
Yes, tolerance stack-up analysis can be performed in Excel. Thus Excel has it's limitations.
Excel is commonly used for simple or basic stack-up calculations, especially for linear dimension stacks and worst-case calculations.
Each country seems to have their 'excel template' that has been circulated and improved, tweaked, altered by each company.
Some excel templates can do RSS, some has a built in parameter list, some has more advanced macros.
When macros are present - you cannot work simultaneously in the sheets. You can in RD8.
When worst case and RSS is not enough - you can work with statistical and Monte Carlo simulations in RD8.
Typically you cannot apply asymmetric tolerances in Excel - you can in RD8.
Filehistory is typically based on One-Drive - often random - in RD8 you work with iterations and user logs.
Excel is prone to errors - if you delete a row or delete a formula in the wrong cell - hell is loose - not in RD8.
Excel gives a lot of freedom to different style for annotation, tolerance setting and assumptions - in RD8 everything is uniform and streamlined.
In Excel you manually have to lookup suiting tolerances - in RD8 suiting tolerances can be looked up automatically.
In Excel - the workflow is scattered between different applications. CAD for screenshots. Power Point or Paint for making annotations. Excel for the calculus. In RD8 everything is in one application.
And the list goes on...
How Can Engineers Learn Tolerance Stack-Up Analysis
Engineers can learn tolerance stack-up analysis through formal engineering education, hands-on design experience, specialized training programs, and the use of tolerance analysis tools.
RD8 offers:
- RD8 Engineering Academy: An engineering academy teaching the theory behind and techniques for how to optimize designs.
- RD8 Software: For working structured and efficient with tolerance analysis.
- RD8 Software Onboarding: Dedicated training courses in how to use all features in the RD8 Software - supported by skilled RD8 tolerance experts.
- RD8 Help Center: support center with online course material, user guides, examples and in depth explanations.
- RD8 YouTube Channel: features tutorials, cases, tips and tricks and much more.
- RD8 Cheat Sheets: quick reference guides to master tolerance design.
- RD8 Consulting: learning by doing. Working alongside skilled consultans gives a lot of hands on experience and saves a lot of costly learnings

What Is Included In RD8's Tolerance Stack-Up Analysis Training?
RD8’s training provides structured instruction on tolerance stack-up analysis, including theoretical concepts, practical methods, and real engineering applications.
- Understand Fundamental Tolerance Concepts
- Apply Geometric Dimensioning and Tolerancing (GD&T) Principles
- Perform Tolerance Stack-Up Analysis
- Design for Manufacturability (DFM) with Precision Tolerances
- Understand ISO and GPS Standards
- Interpret and Modify Technical Drawings Based on Standards
- Collaborate Effectively in Tolerance Design
Set up a free RD8 Software Trial for your team
Book an initial meeting to:
Let us know your contact details - and any additional clarification points - then we will get back as soon as possible.
By submitting, you accept RD8's Privacy Policy and Terms of Service.