Robust Design: Definition, Examples, Principles, and Process
Robust Design is sometimes best explained by it's antonym: 'when something is very sensitive' - Robust Design is just the opposite this. it minimizes the sensitivity.
Taguchi defined the term robustness and described it as a design with a functional output with minimal sensitivity to its input variations.
This is especially important in high-volume production, where every possible combination of variation will eventually occur.
In sensitive designs, this variation will cause malfunction in function, reduced performance or shorter lifetime of the product.
For example, imagine a medical device that should give you a precise dosis of a certain drug, but due to an unlucky combination of parts, you end up getting too much or too little dosage.
In cases like this Robust Design is important to ensure the desired functionality, product after product, day and night, hot or cold.
Trusted by engineering teams building high‑performance mechanical products


Robust Design Breakdown
RD8 divides the Robust Design mindset into 8 disciplines - all in the context of being insensitive to variation.
RD8 Disciplines
Motivation


Context
Interface Design: Making sure that geometry defined in CAD is robust in the sense of predictability. Making a predictble model is step 1. When predictability is ensured - the CAD model and placement of features can be optimized.
When talking about robustness of the CAD model, the key is to focus on how interfaces between parts are designed - they are paramount for a design to be robust.
Robust Design EXample
In the adjacent video - two sliders are shown.
They are both designed with the equal clearances and produced with same accuracy. Only the geometry and constraint-sets are different.
In the nominal (perfect condition) they both run smoothly. This is typically equivalent to testing with perfect prototypes in controlled environments.
In real life we are exposed to variaion all the time; manufactuing tolerances, assembly tolerances, use cases, varying material properties, etc.
In the video - the sliders are exposed to variation by triggering a small mechcanis that forces the rails out of the ideal alignment (simulating variation).
One slider is not impacted by variation of the rails.
This is the Robust Slider.
The other slider jams/gets stock by variation of the rails.
This is the Sensitive Slider.
In the Sensitive Design you need to keep many dimensions in control compared to the Robust one.
E.g. the distance between the rails and the parallelism between the rails. Thus more costly - and still more vulnerable to variation.
Examples of Interface Rules
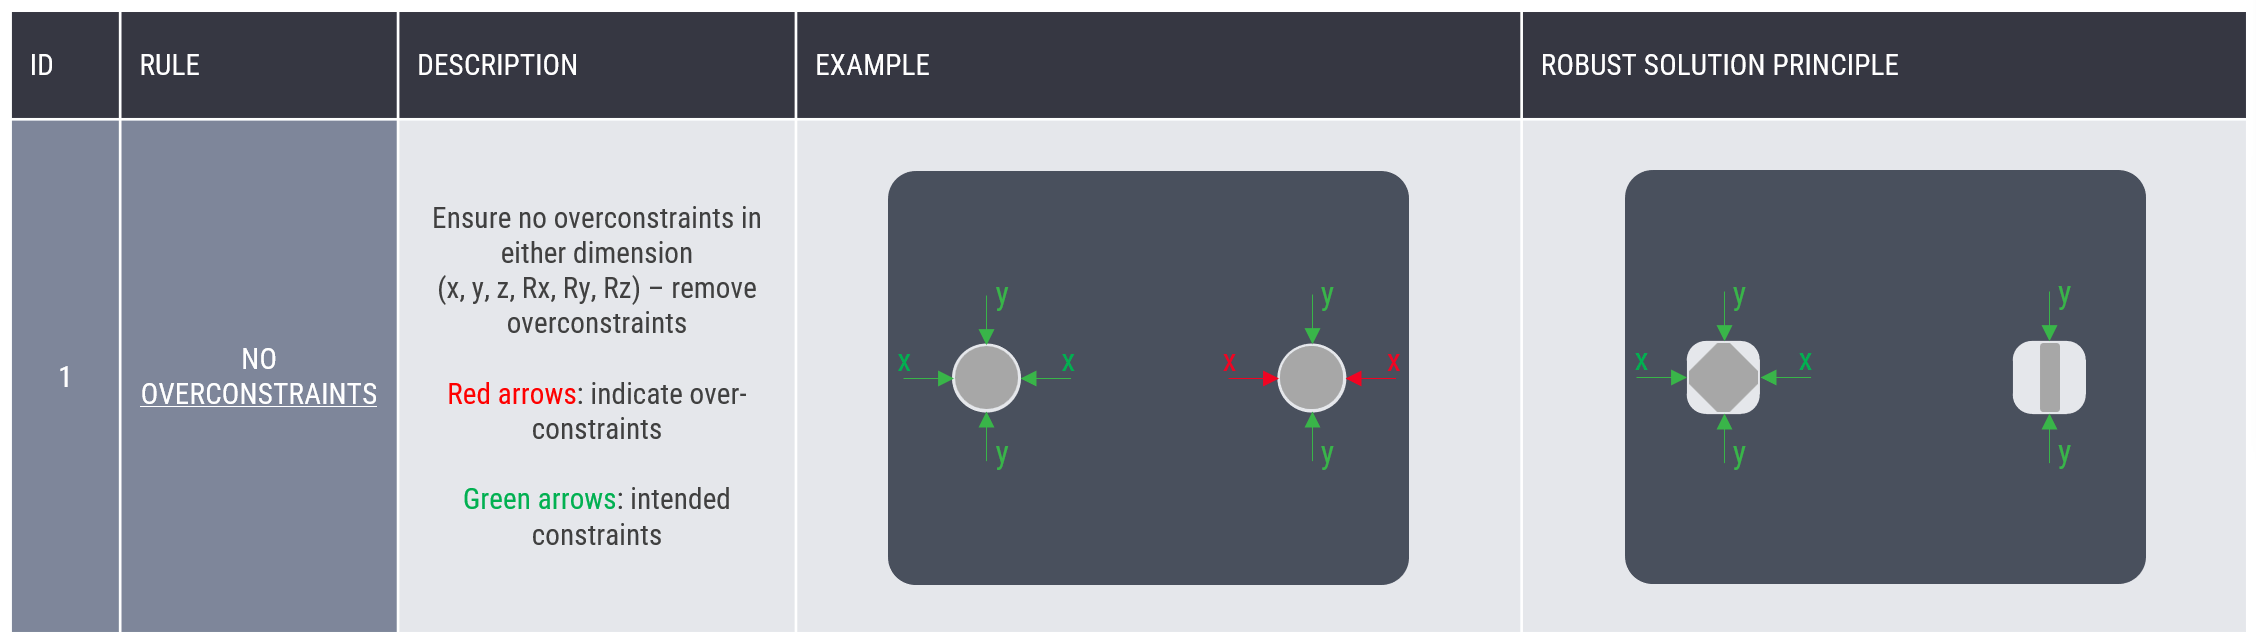
Interface Design - Rule Number 1: Ensuring that a design is not overconstrained is paramount for predictability and to ensure clarity in tolerance stacks. In the example with with two pins and two holes, the two pins are fighting to position in the x-direction - you have no chance of figuring which one will control the positioning. If you leave clearance on one of the pins, you are always in control of which one will position the part.
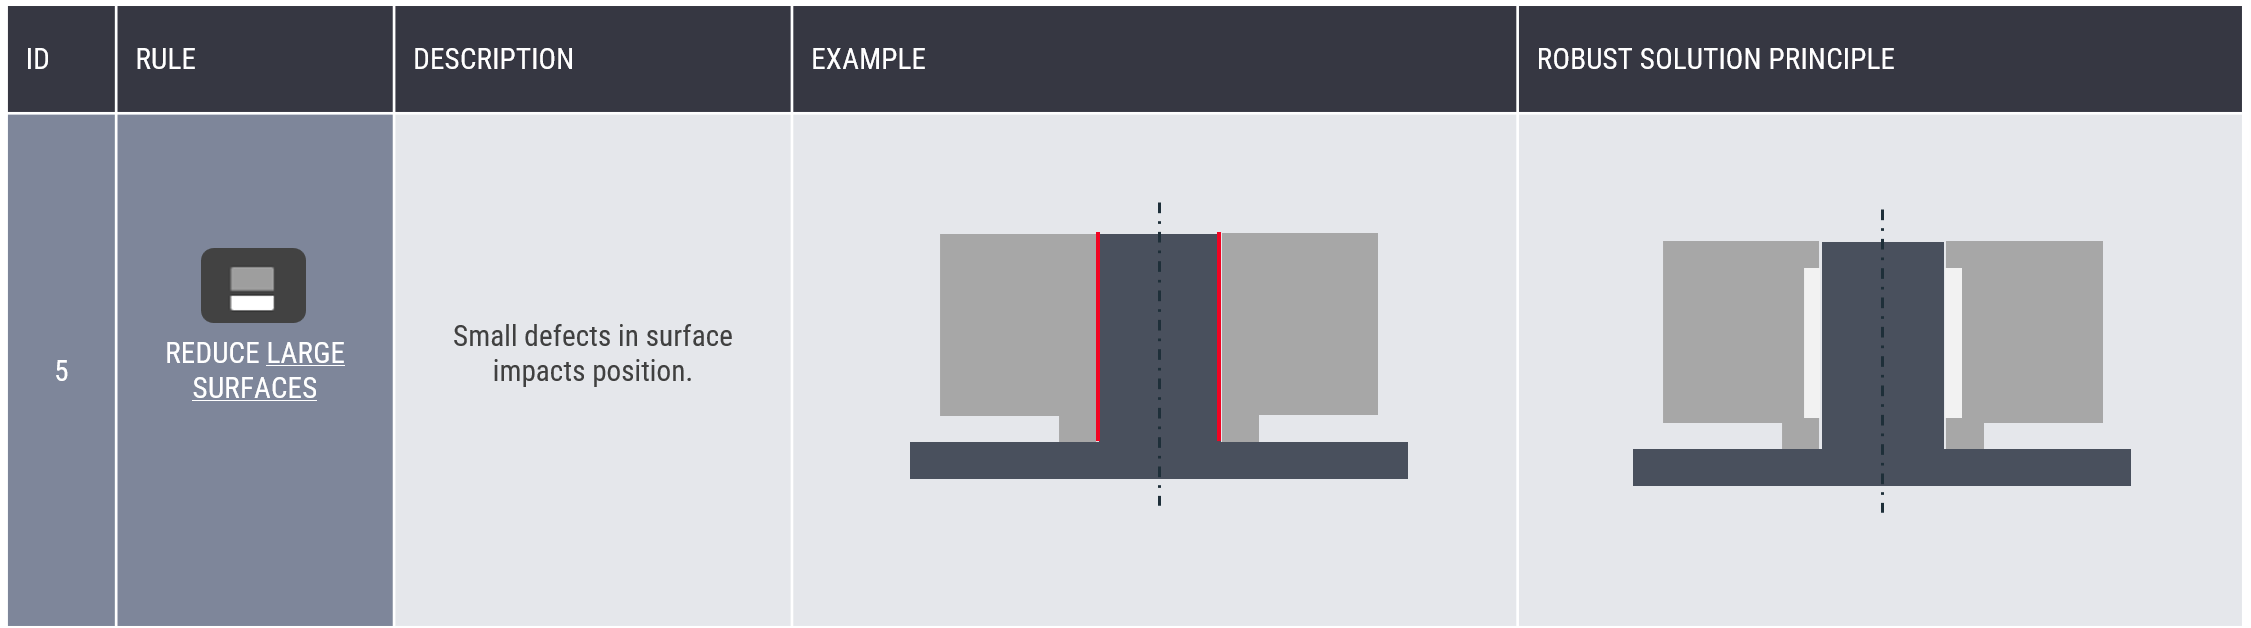
Interface Design - Rule Number 5: In this example, achieving a good fit would require you to control the whole surface - not allowing for the shaft to be concave at any point.
By making clever cutouts and well defined interfaces you can allow the 'non important' geometry to vary without affecting the function of the part.
Consider a flat surface as another example. While it may appear that the whole surface must be tightly controlled, in practice only three contact points are required to define a stable plane. Instead of tolerancing the entire surface using GD&T controls like flatness or form tolerance, you can design three small, controlled contact areas (plateaus). This simplifies manufacturing while still ensuring proper functional behavior.
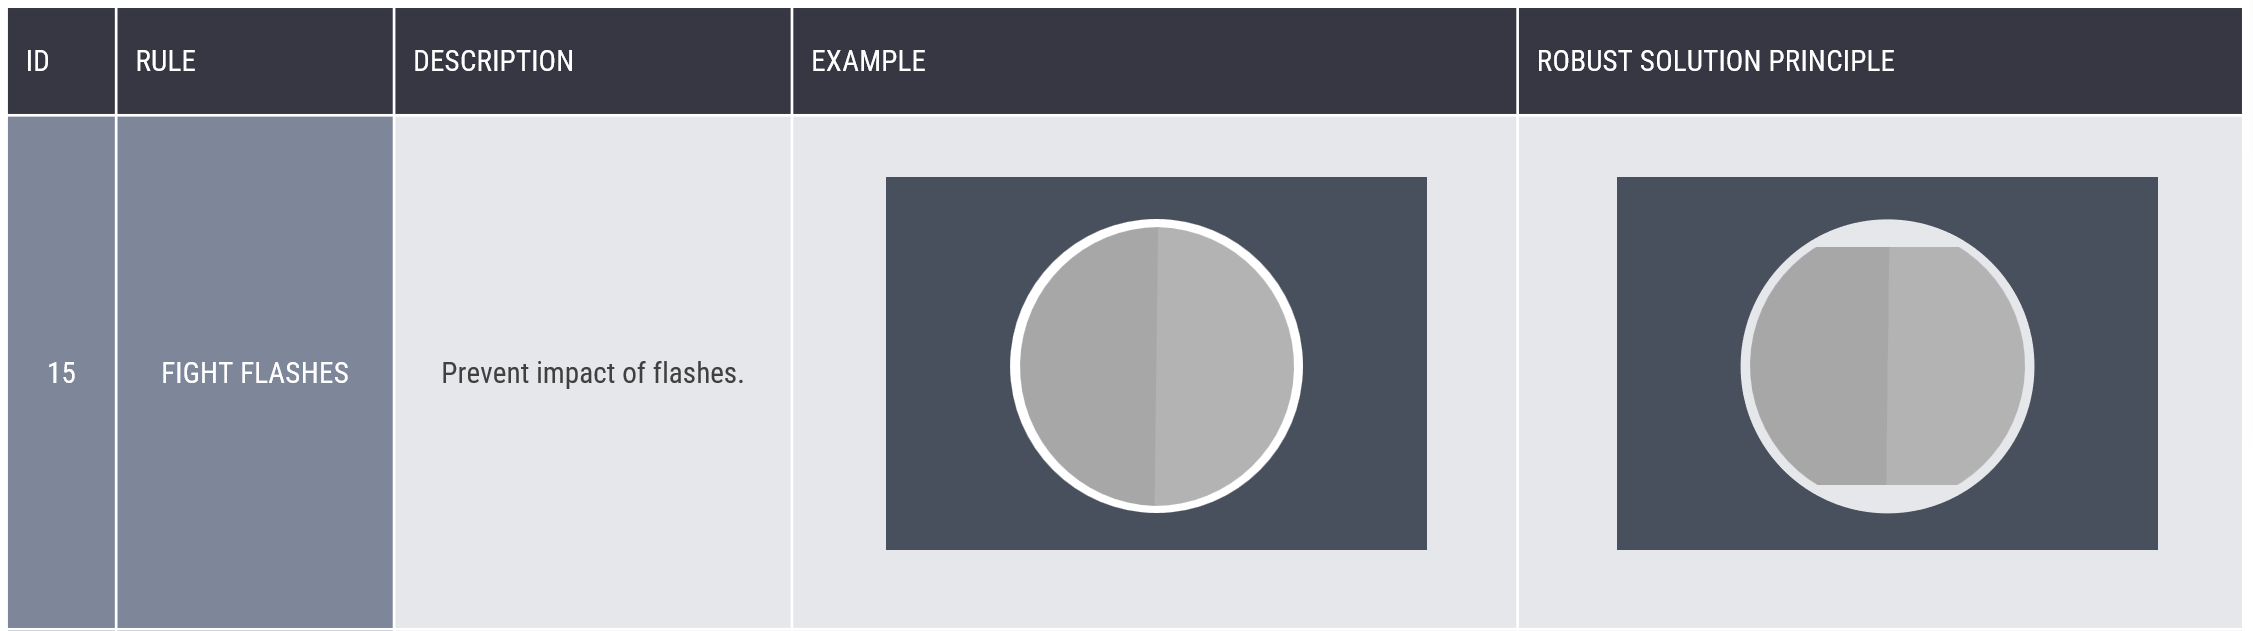
Interface Design - Rule Number 15: If you are working with moulded parts - make sure to account for flashes.
The full list of interface rules can be found in the RD8 Help Center embedded in RD8.Software. The rules and principles is built-in to the RD8 Software and is a part of the Interface Analysis tool and the Automated Interface Screening.
Functions and Sensitivity
The classic example is the wall bracket for a TV - if you wish to make the best horisontal alignment, the best choice is a wide bracket instead of a narrow bracket.
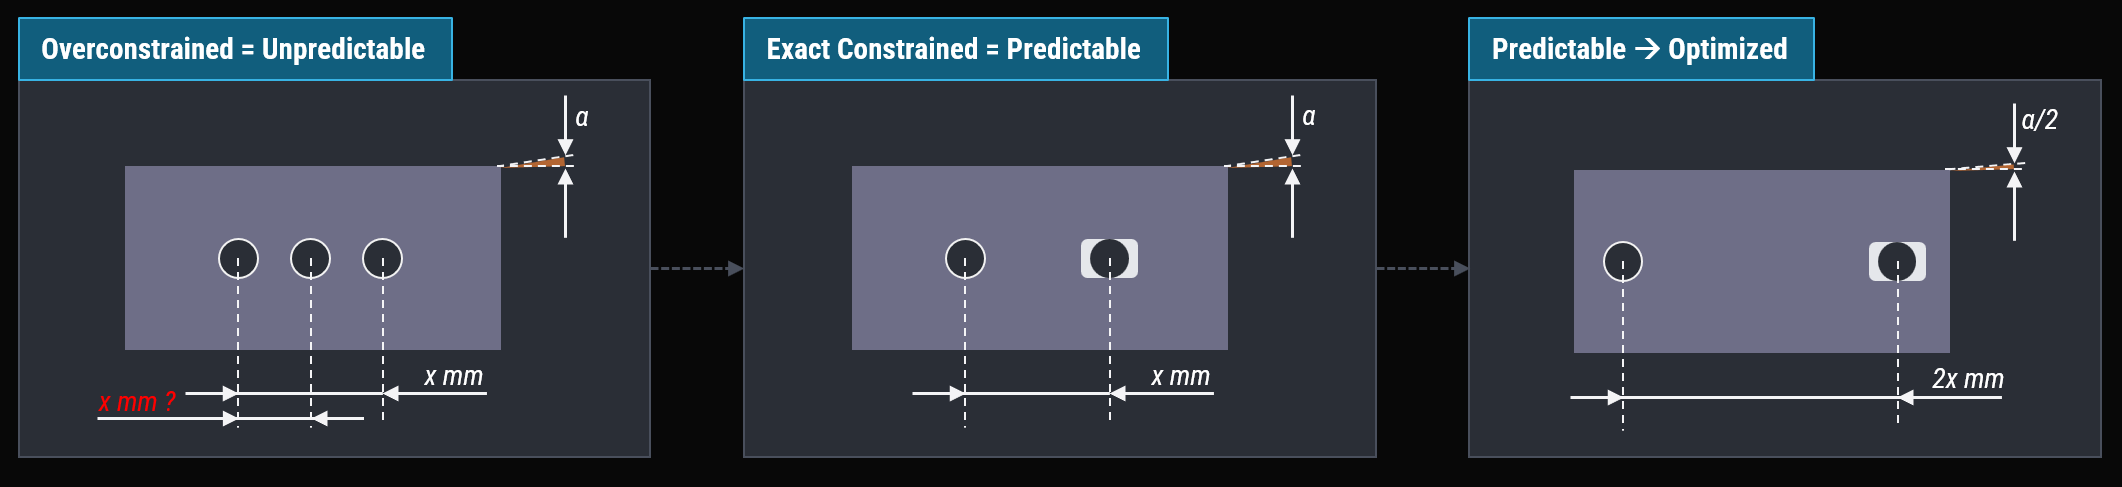
First step is to ensure that the interface design is not overconstrained so predictability is ensured.
When done, you can start to calculate and set up the transfer function/tolerance stacks that you can trust. It is also typically much easier to dissect a problem or design when the design is predictable.
The optimization of the design can be proven by determining a transfer function and analysing it by sensitivity analysis. Sensitivity analysis is embedded in RD8.Software. In this simple example you will figure out that the distance, x, between the bracket holes is determining the angle, alpha.
If you double the distance from x to 2x, the angle error, alpha will to from alpha to alpha/2.
Design Drivers
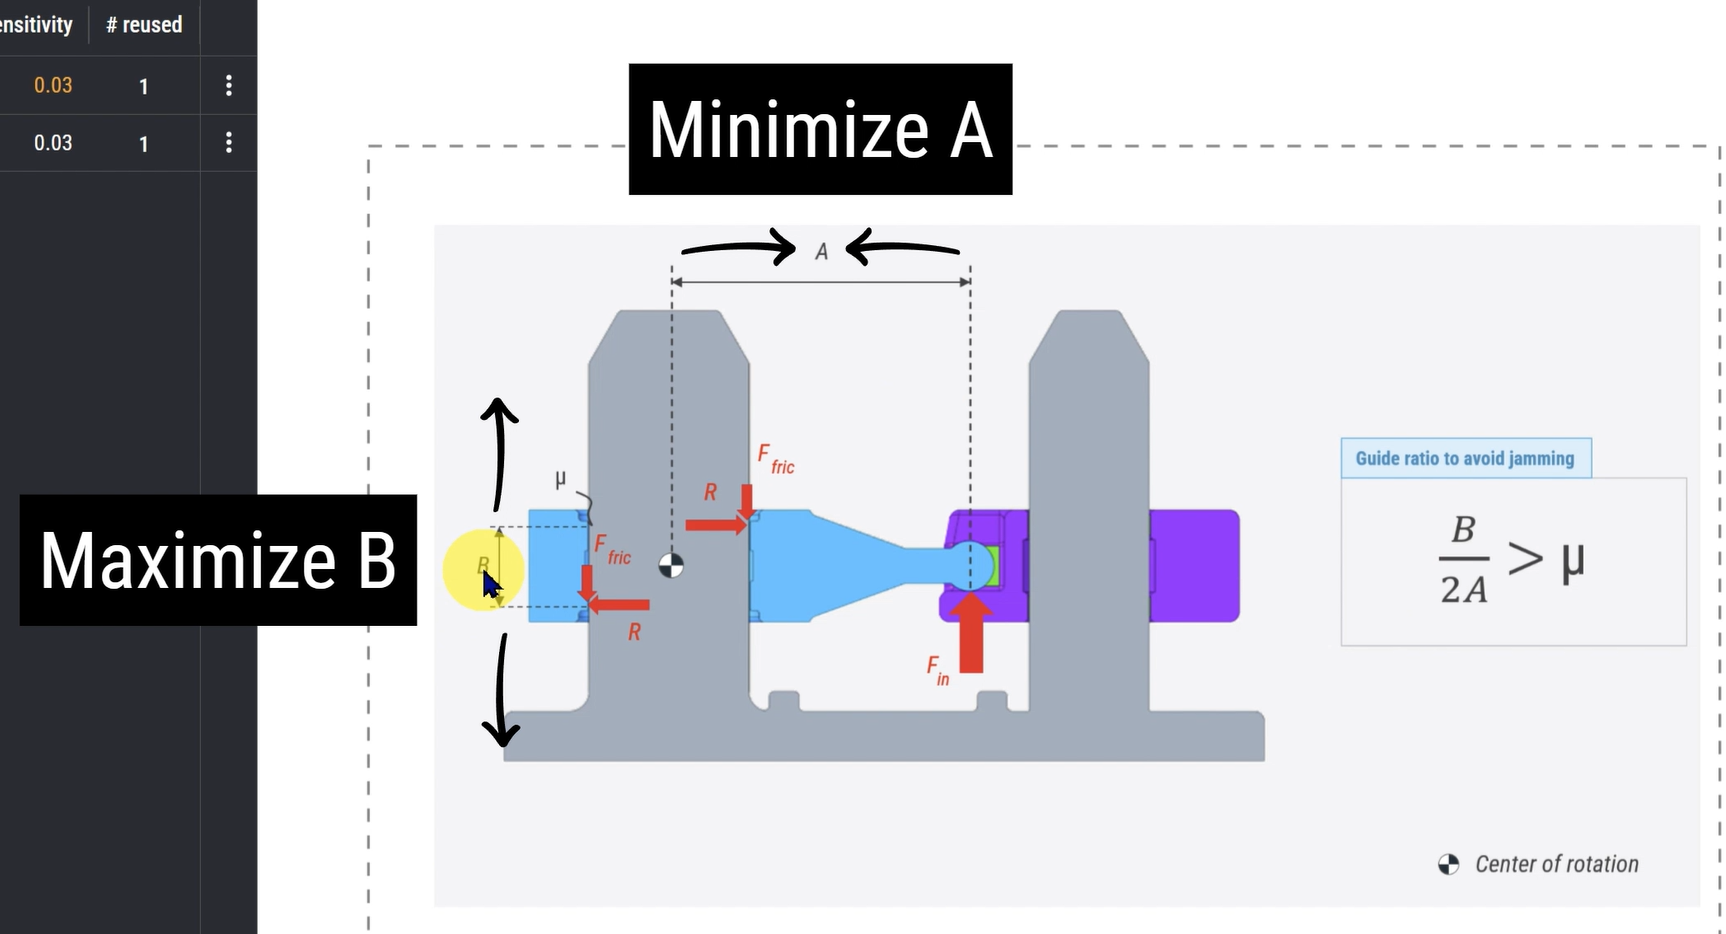
Design Drivers refers to the basic understanding of how to best achieving a given function. Let's say you want to make the best drawer/slider. The basic understanding for how to optimize this comes from understanding the physics behind it.
In this 'Guide Ratio Calculator' the math between a slider function is explained.
The design drivers for making the best slider possible is to:
- Minimize A (place the attack point - e.g. the drive of a motor or a belt in the center of the slider)
- Maximize B (maximize the distance between the sliding surfaces) (and with respect to interface design - ensure that this is always a pair of sliders - instead of a full profile that in theory can be concave)
Also see this example with a syringe.
The robust design lifecycle model
The RD8 Robust Design Lifecycle model is defined by 5 steps.
Understand the system - set direction for the project. Align requirements and product specfication.
Ensure that the concept intent is not overcomplicated and that there is a plan.
Ensure that the system is optimized for robustness and you don't end up with something that is sensitive.
Optimize for all aspects of mechanical engineering; material selection, process selection, assembly, strength of parts.
Ensure that the product behaves as intented. Ensure that important dimensions are defined, clearly marked and that an quality strategy is set up - together with a learning feedback loop.
Applications of Robust Design
Robust Design theory can in practice be applied in all design cases - but may be overkill for a lot of one-off designs. RD8 specializes in application for high volume production of must-not-fail products in 3 categories:-
- Automotive
- Industry (consumer products, B2B products, robots, ...)
- Life Science (auto injectors and medical devices)
Furthermore RD8 can be used very early in the design process - yielding design confidence from day 1 where other systems rely on a complete CAD model.
Illustration of a 3D part in CAD.
In its nominal (original state) and simulation of a deviation (variation from nominal)
What is Robust Design?
Robust Design is an engineering methodology focused on making designs insentive to variation.
Robust Design differs from traditional design approaches by focusing on design rather than manufacturing.
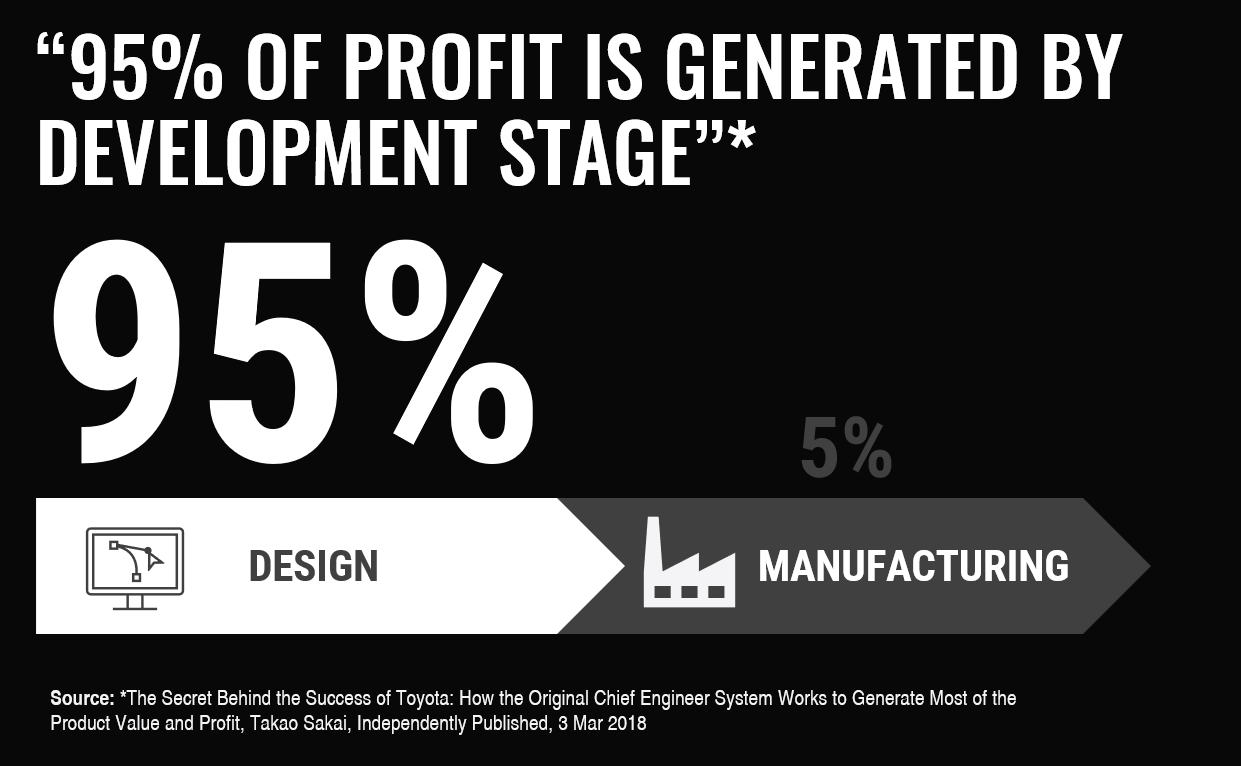
95% of profit is defined in the design stage*. That means that ultimatively the main power is at the design team. Reflect on this. Toyota have been open about their production system and have gained massive traction and reliability recognition both at customers and production specialists. But their product development strategy is very secret.
(Source: *The Secret Behind the Success of Toyota: How the Original Chief Engineer System Works to Generate Most of the Product Value and Profit, TakaoSakai, Independently Published, 3 Mar 2018)
Robust Design aims towards addressing the 'Design Quality' by making top performing mechanical designs that serve the intended function at the lowest cost to offer the user most value for money and maximise profit to the company.
The primary goal of traditional design is to meet specifications. But the goal of Robust Design methods is not just to meet specifications. It aim is to be closer to the target value than being within the limits. And by staying within the limits of the minimum requirements to production/tolerances - hence being robust to any noise factors (part tolerances, assembly tolerances, use cases, temperature, ...) and to be robust to any variability in the product use case or production process.
One can buy the most expensive manufacturing equipment, the most expensive and experienced production worker, the best Quality Control systems and achieve a good product.
Robust Design is about achieving a good product by being smart rather than by being extra careful and accurate in all dimensions.
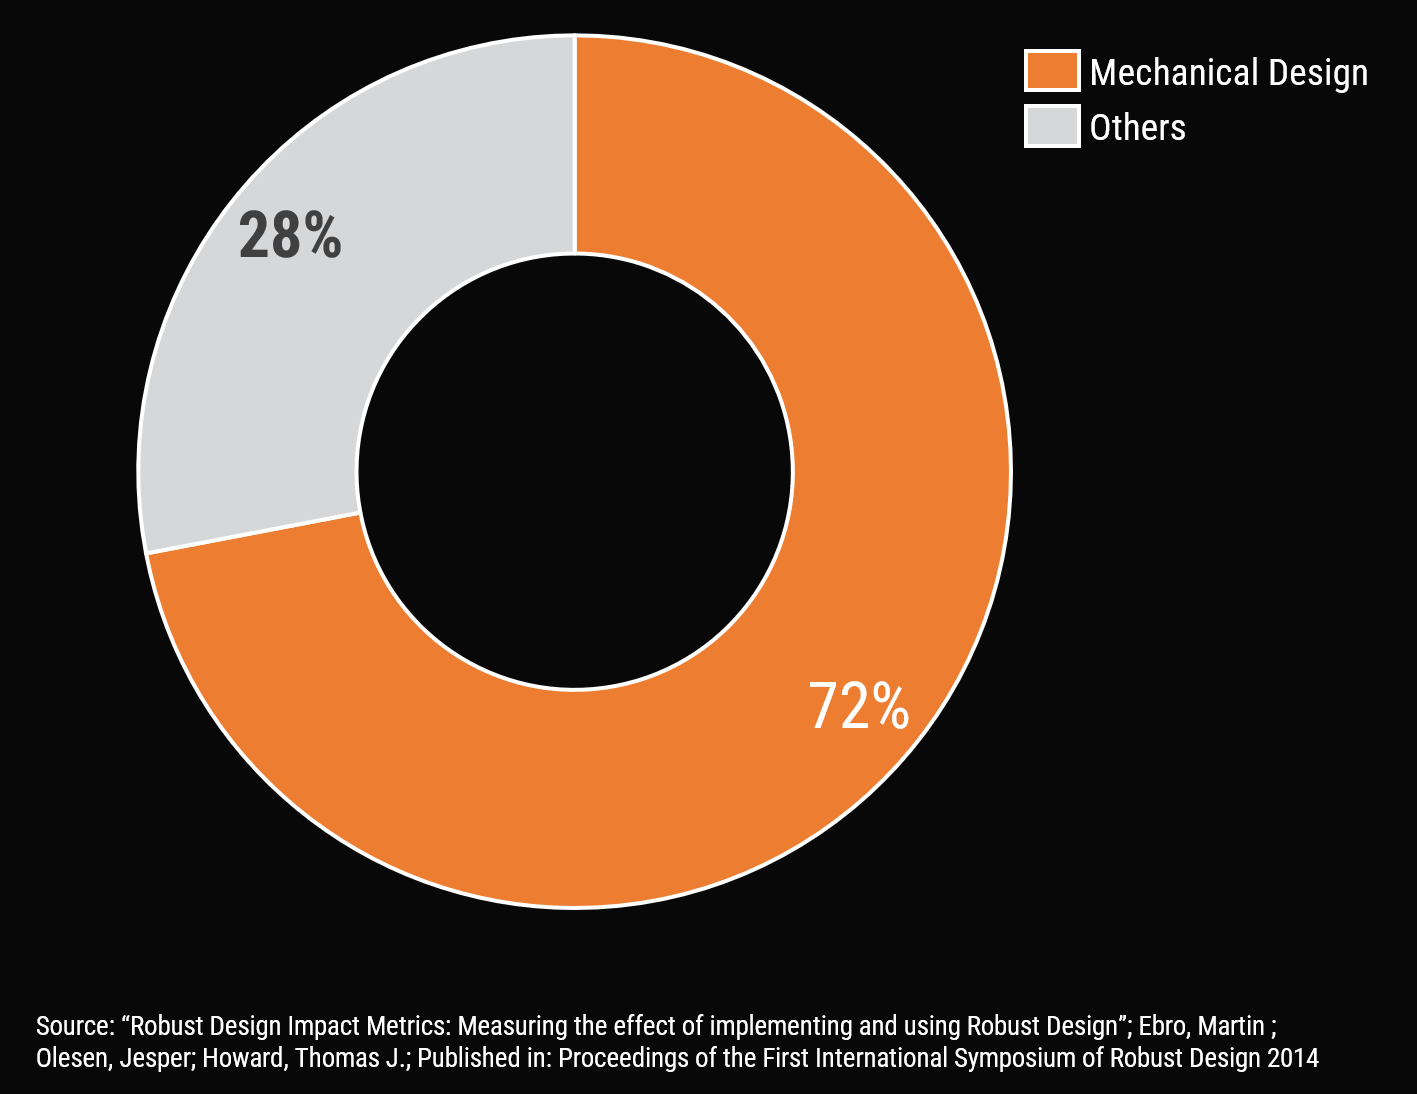
The graph to the right represents an analysis at a consumer electronics company - logging root causes after design freeze. Turns out that 72% is related to the mechanical design.
The case is the same in many other industries. The root cause is the mechanical design. The robot arm does not move as intended. The root cause? The friction in the joints that should not be there - the software did not compensate for this.

Why Robust Design Matters in Engineering and Manufacturing?
Robust Design matters in engineering and manufacturing because being smart is the key to be competitive - incresing quality, increasing speed and lowering cost.
Increased Quality
Why it matters
The reason
Robust Design Methods ensure the minimum amount of dimensions to be kept in control together with optimal placement for robustness of functions
Fewer dimensions to keep in control with less strict requirements.
Better performance = better perceived quailty of customers.
Better reputation.
The logic
Increased Development Speed
Robust Design Methods ensures predictability from day 1. Ensures a guided approach for ideal placement of features to get it 'right the first time'.
Fewer iterations due to higher understanding and predictability of the concept, system, parts.
Lower Cost
Robust Design Methods ensure the minimum amount of dimensions to be kept in control with less strict tolerances
Parts are easier to source, easier/faster/simpler to manufacture, easier to inspect.
Assemblies are easier to test and verify.
Fewer warrently cost/claims/recalls.
What Are Real-World Examples of Robust Design?
The term “robust” is often misinterpreted as a tough, somewhat strong, rigid, and well dimensioned design, but that is not the case. The term is better described by its opposite: “sensitive”. Thus, a Robust Design is not sensitive – meaning that variation in the product will have minimal influence.
In essence, the meaning of Robust Design is to minimize the impact of variation in a product. For example, suppose the product gets exposed to variation in production (e.g., tolerances or material abnormalities) or use case (e.g., where the user is applying force or holding the product). In that case, the end-user should not experience any change in the product’s behavior.
Medical Device Robust Design Example
Primary Function
To ensure realiable, activation, activation force and dosing accuracy. Without Robust Design, there will be a risk of spontanious activation, an activation force off target and risk of wrong dosing.
Variation Sources
Ensures usage in all conditions. Odd use cases, extreme temparatures, and in extreme high production volumes.
The controllable design parameters are the geometry of the parts and the assembly equipment.
Methods Used
Through interface design, function optimization (setting up transfer functions and parameter studies), and continious tolerance stack reviews and refinements ultra reliability was achieved.

Automotive Robust Design Example
Industrial Robust Design Example
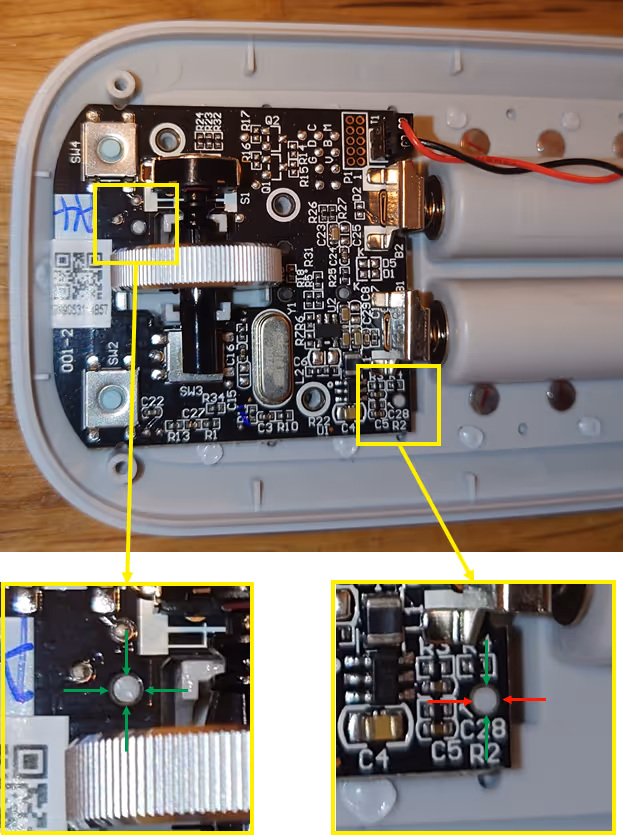
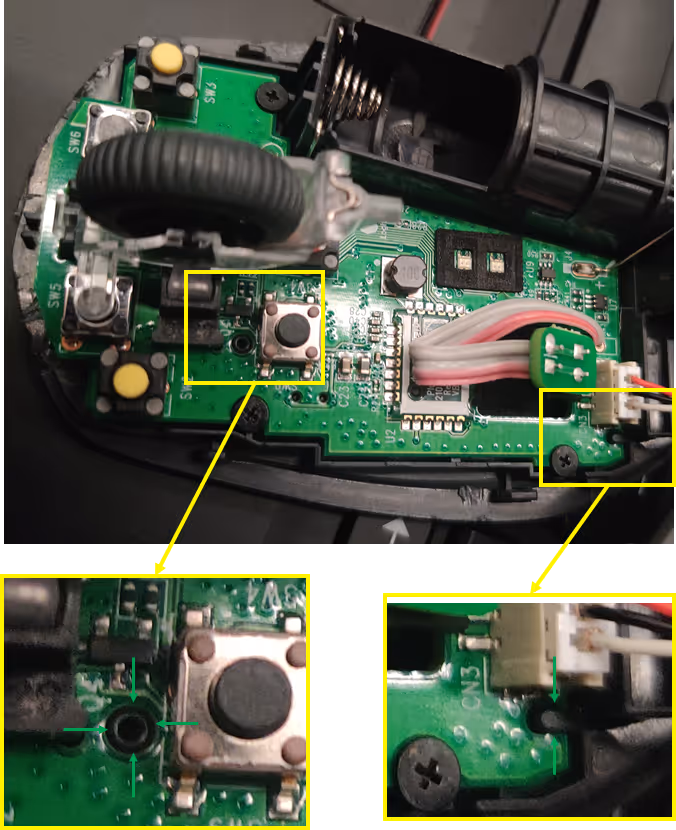
In the example - two different products are shown.
A Microsoft mouse - A Logitech mouse.
The focus of this example for both products is the interface between the “housing” plastic part and the PCB part. With respect to the Interface Rule Number 1 - the Logitech Mouse is good - the Microsoft Mouse is bad.
The Logitech mouse: the PCB is positioned by a “positioning pin” and a “second pin” where there is intentionally added the needed clearance to accommodate for expected variation between the pins – hence making the interface robust.
The Microsoft mouse: the PCB is overconstrained and there will be an additional need to keeo the tolerance between the position pin and the second pin - in both the PCB and the frame part.
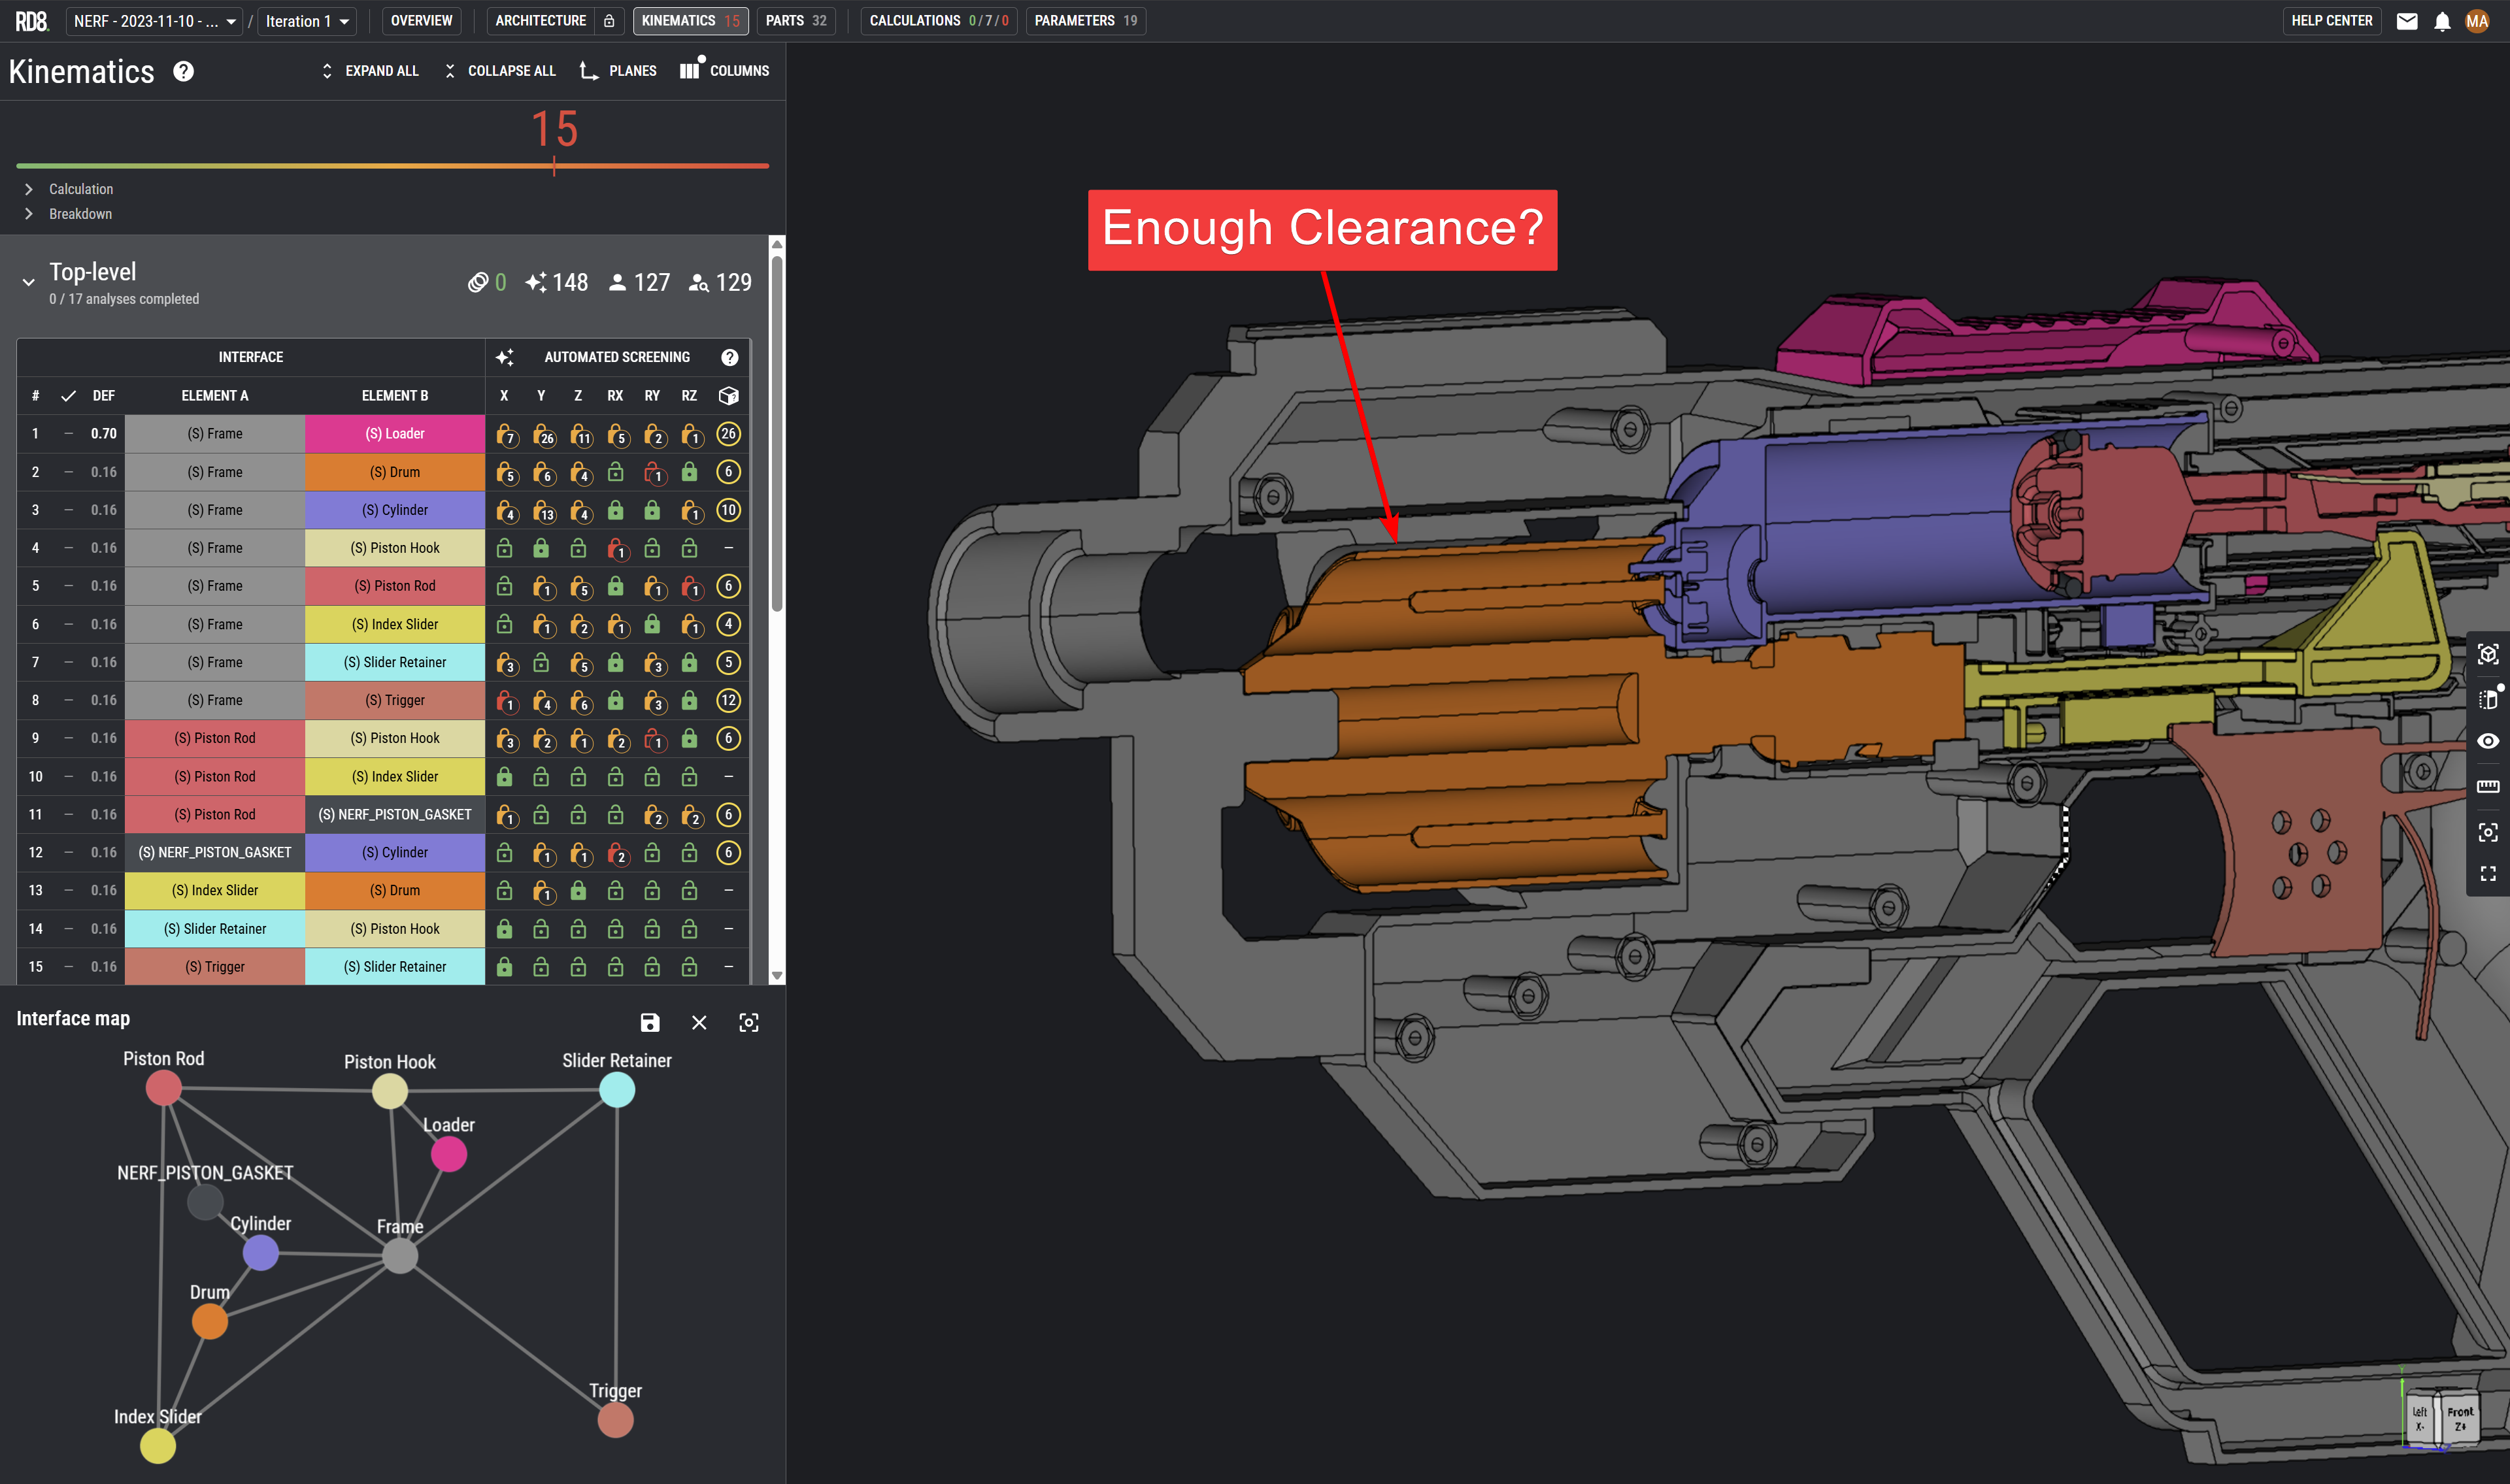
System Design
Interface Design
Tolerance Stack-ups / Functional Analysis
What Are the Core Robust Design Principles?

Minimizing Information (reduction of complexity)
If dimensions, tolerances, features can be eliminated - this is the way to go.
Indepence (decoupling and clarity)Ensuring clear functional surfaces, without multi-functions, clear tolerance- and load paths.
What Is Axiomatic design in Robust Design Context?
As the market requests for new products increase and higher demands are set for frequency. Therefore there is a demand for fast product development of healthy designs. Meaning that the development “requires efficient and systematic procedures to analyze, synthesize, and validate conceived concepts upfront”*.
* Source: Kai Yang 2003, Design for Six Sigma: A Roadmap for Product Development. United States of America: McGraw-Hill, p.201
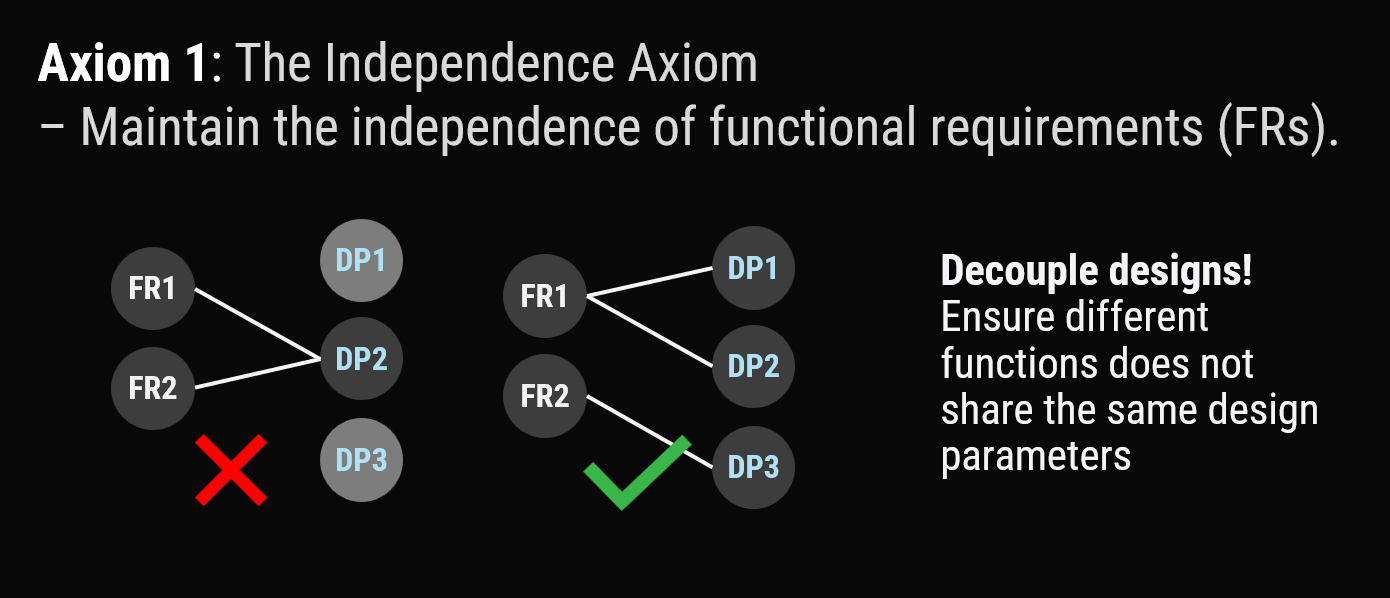
Nam Pyo Suh has developed the methods of axiomatic design since 1977, and the methods state two axioms: The independence axiom and The information axiom.

Axiom 1 | The Independence Axiom
Maintain the independence of the functional requirements.
Axiom 1 is about decoupling functional requirements and making them independent from each other. This is done by decoupling the design parameters of the functional requirements.
A typical example is a water hose which has two functions: temperature and flow.
Some designs change the flow whenever you want to adjust the temperature – this is a coupled system.
If you follow axiom 1, you decouple the two functions (as seen in some designs) where temperature-function and flow-function are separated.
These principles are, e.g., reflected in practice in the RD8 interface rules – to ensure functional surfaces in an interface have the ideal amount of information.
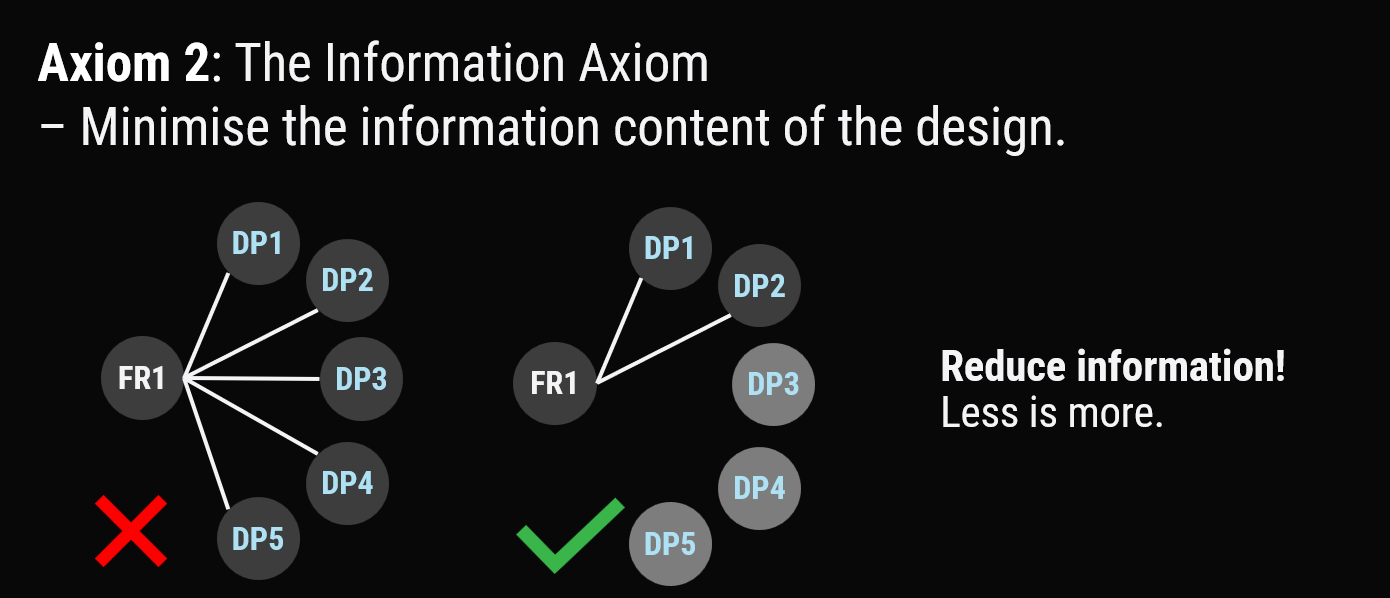
Axiom 2 | The Information Axiom
Minimize the information content in a design.
Axiom 2 has to do with the complexity of the design and is related to the theory of Taguchi. It is based on the probability of successful manufacturing of a design. If you lower the complexity of a design, you are more likely to hit the target and drop the product’s quality.
Complexity is related to minimizing information – in practice – reducing the number of constraints in a system. This reflects in the RD8 interface rules and mobility theory.
What Is the Taguchi Method for Robust Design?
Taguchi methods are a part of the Six Sigma framework – one of the largest business management systems today. Something that has improved processes and saved billions of dollars for companies.
In Six Sigma, one of the main objectives is “to increase performance and decrease performance variation” in a process.
A process can be a service- or a product process, e.g., a production process or a billing process. RD8’s focus is on the design of robust physical products – not services.
Genichi Taguchi states that “any deviation from a design objective constitutes a loss in quality”. Furthermore, he states that it reflects a financial loss due to a potentially reduced product life, performance, and economy.
In addition, the deviation of a design can influence the economy due to a loss in customer satisfaction, service and repair costs, market credibility, and a potential loss of market shares.
Taguchi defines the term robustness and describes it as a design with a functional output with minimal sensitivity to its input variations.
Product functions can be described by math and physics – in robust design, descriptions of functions are often referred to as:

- Input-output functions
- I/O functions
- Transfer functions
- Calculation models
Their sole purpose is to describe a product function, e.g., assembly force, user input force required to activate a product, etc.
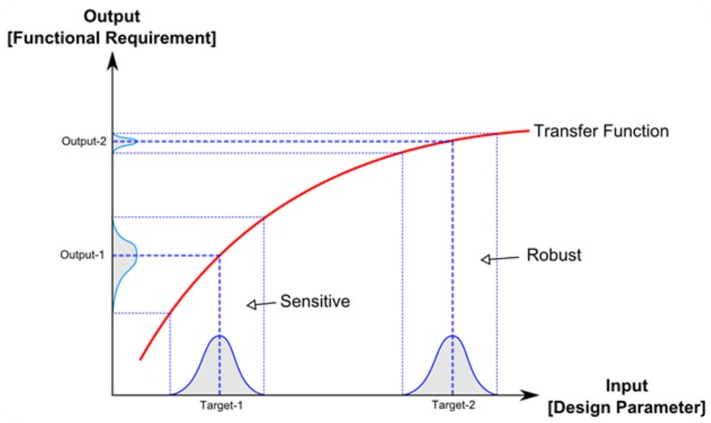
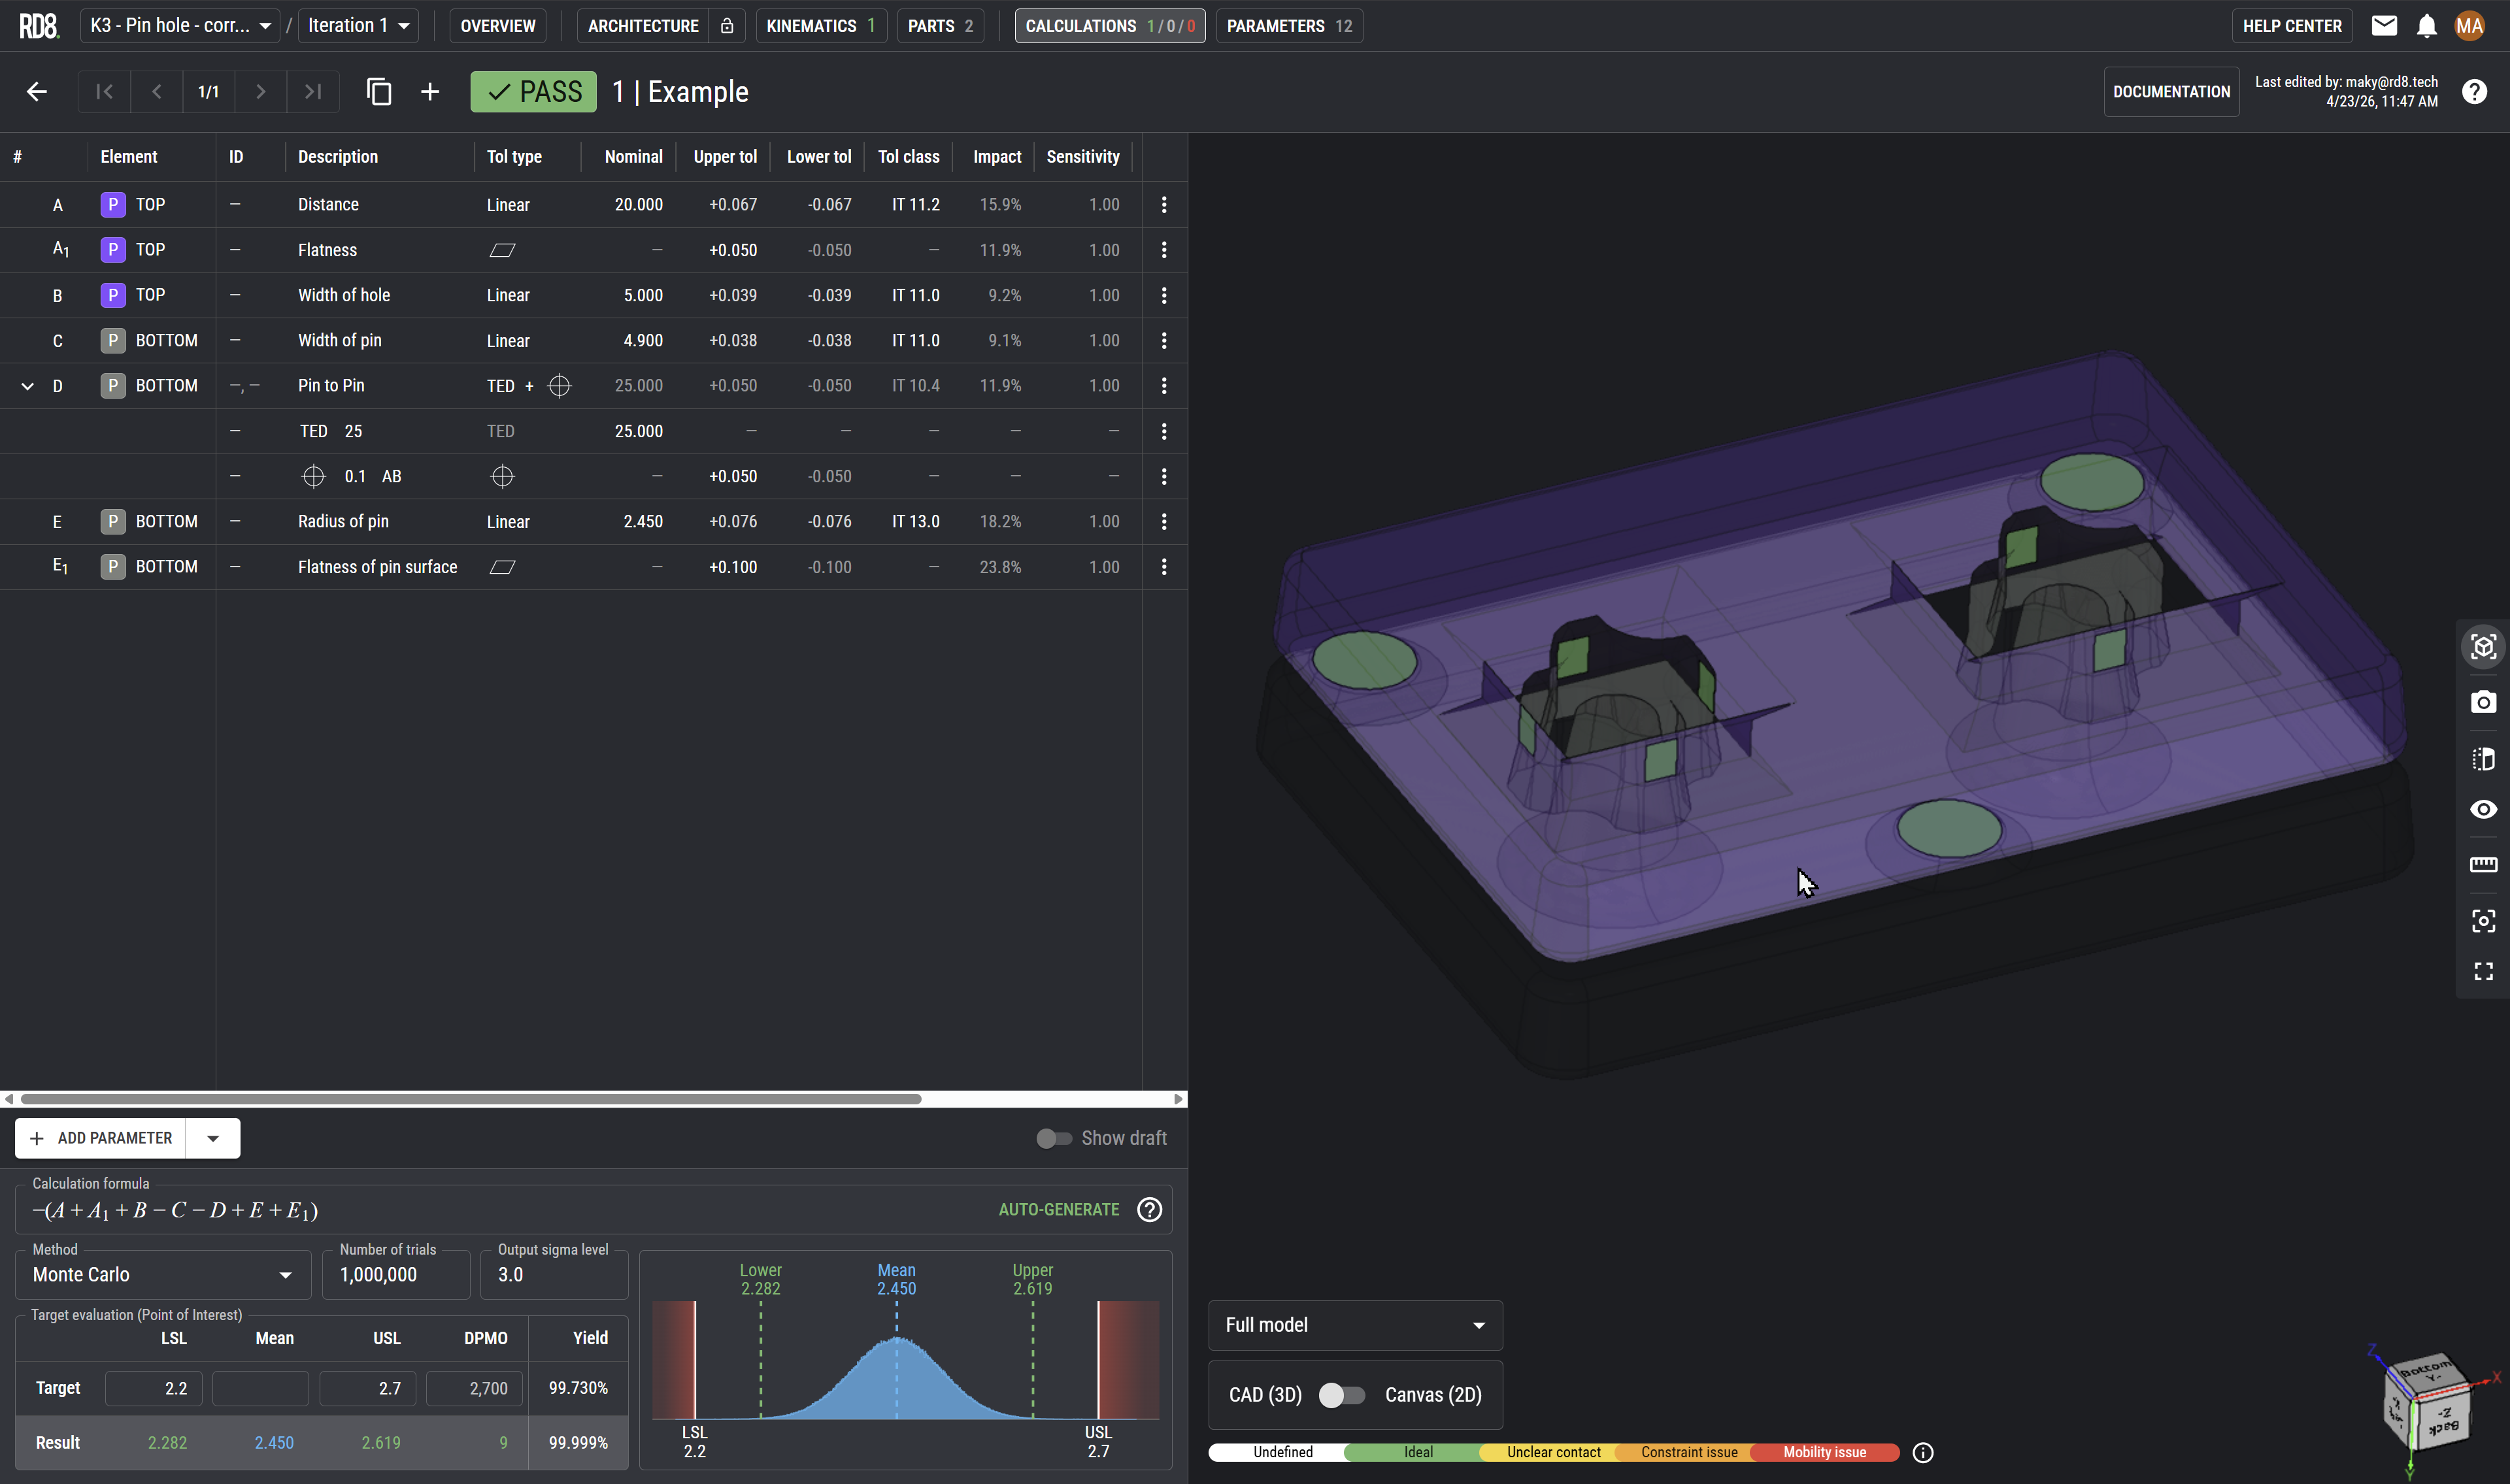
When the transfer function is known, it can be analyzed and plotted on a graph. You can see an example in the illustration above.
On the x-axis, the input or design parameter is given. On the y-axis, the output or functional requirement is given.
A design parameter (e.g., a measure on a technical drawing) will have a tolerance, and in a production setting, the measure will fall out in some sort of distribution in this case.
In the example - the given tolerances are assumed as normal distributions.
For the two different targets “Target-1” and “Target-2” in the illustration, it is seen that the same distribution at “Target-1” and “Target-2” is applied, but that the output is different.
The variation of “Output-2” is much less than “Output-1”; eventhough they are produced with the same tolerances.
To dimension a design so that it serves 'Target-2' and 'Output-2' rather than 'Target-1' and 'Output-1' reflects a Robust Design.
In essence this is what defines if a function is sensitive or robust – if an input reflects a small output - as shown in the illustration.
What Is the Robust Design Process?
RD8 apply the Robust Design mindset into 8 disciplines - all in the context of being insensitive to variation.
The Robust Design Lifecycle Model
The RD8 Robust Design Lifecycle model orchestras the principles in order/sequence in 5 steps - from project start to start of production. The elements from this model is typically augmented to a company development model.
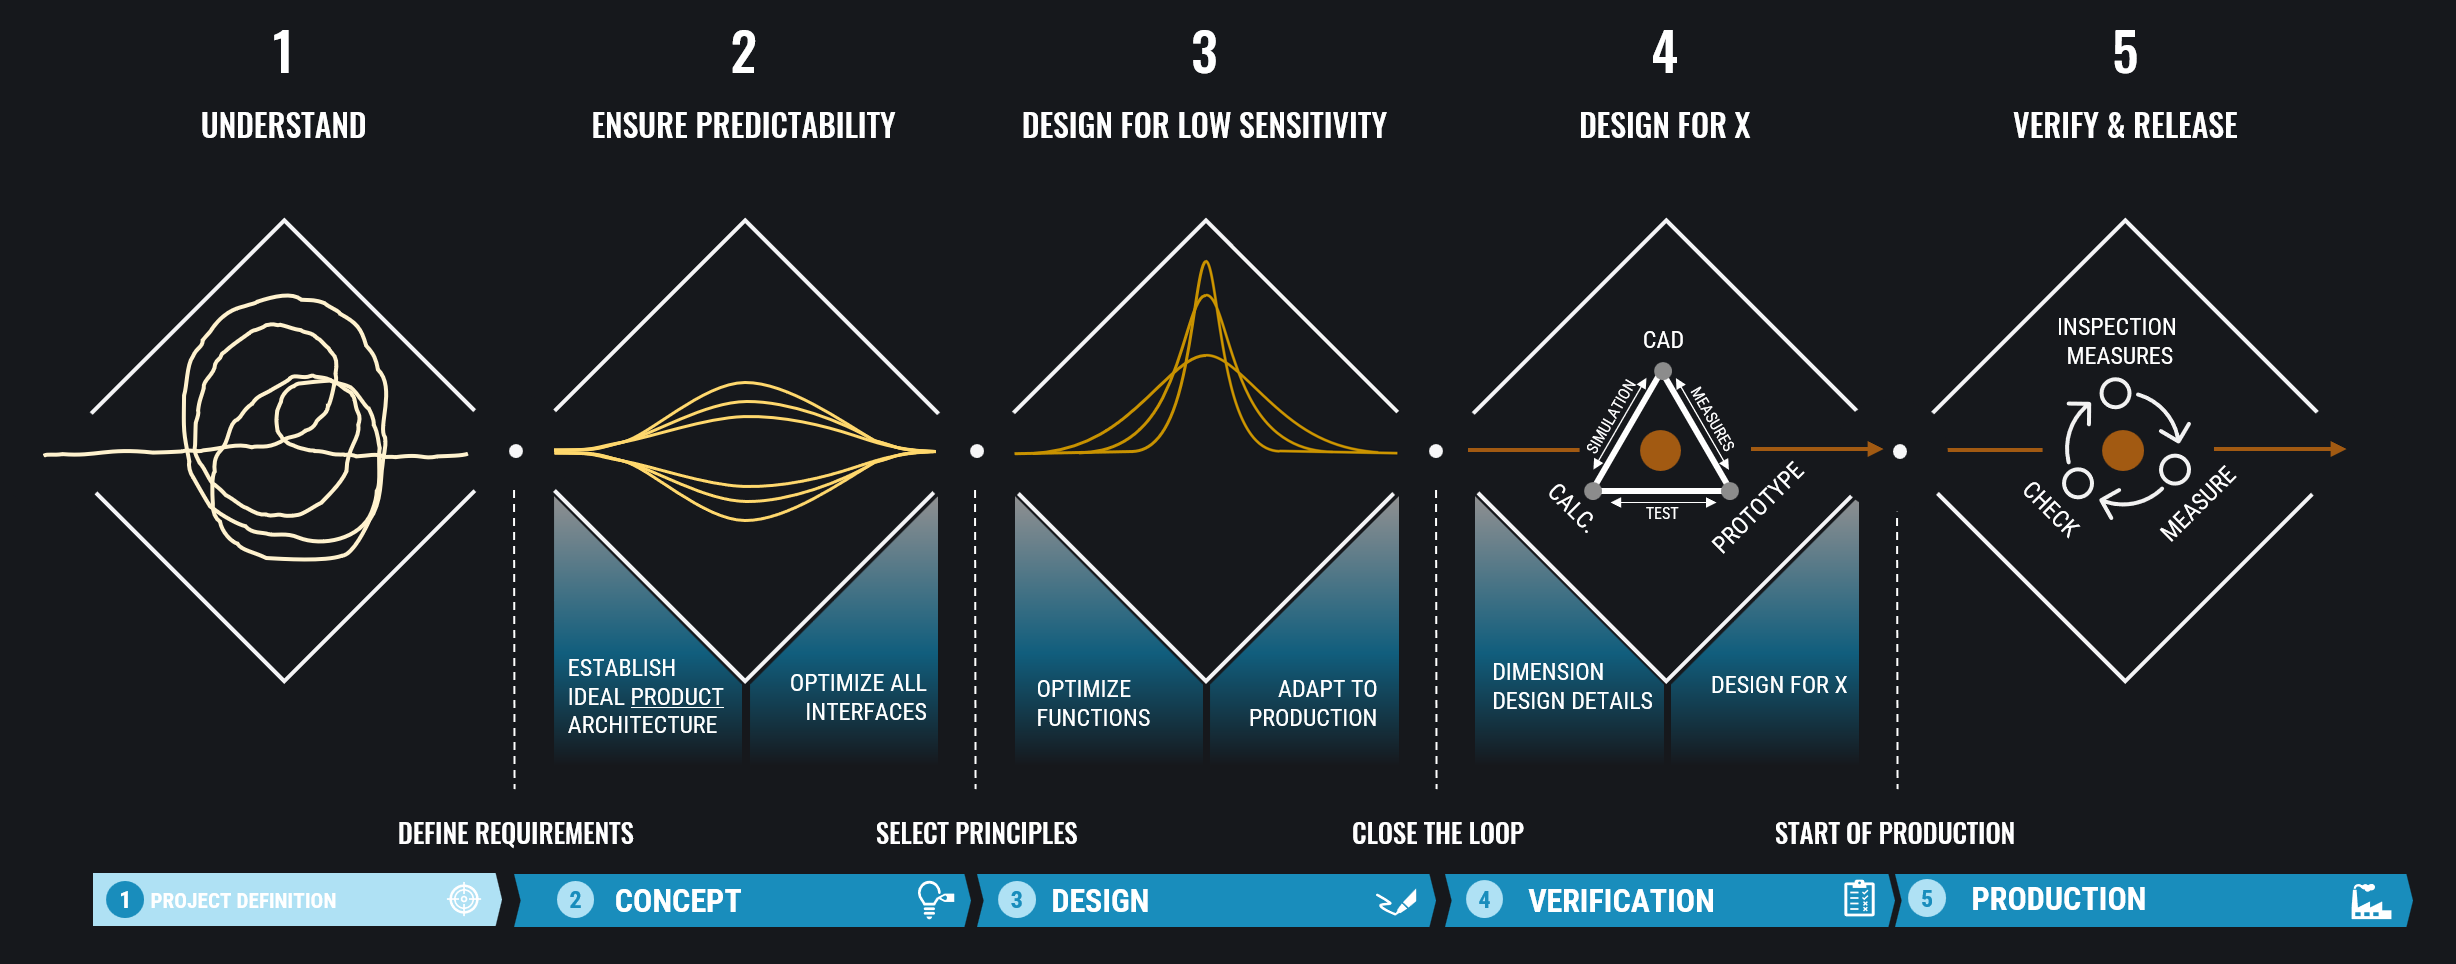
Understand the system - define design drivers. Do cost planning. Decide on main functionality and requirements.
Design product architecture. Define ideal interfaces based on kinematic theory.
Describe transfer functions - set up tolerance stacks - do tolerance analysis - do sensitivity analysis - optimize for maximum robustness. Align with manufacturing processes (tolerance capabilities), DFM, DFA, material selection, and structural integrity.
Close the verification triangle. Establish coherence between calculations, CAD model, and prototypes. Progress from prototypes to real manufacturing processes.
Define inspections measures for CtQ. Monitor production. Check that measurements are within tolerances. Ensure feedback loop from production to designers.
What Are the Applications of Robust Design?
Automotive
Life Science
Industrial Products
What Are the Benefits of Robust Design?
A breakdown of Robust Design benefits
Robust Design Enabler
Technical
Operational
Strategic
Predictability
- Consistent behavior of designs
- Reliable QA
- Eased trouble shooting
- Fewer tests
- More confidence in new designs
- Faster time-to-quality
- Consistent quality
- Innovation height/new solutions
Minimum Complexity
- Fewer dimensions and tolerances to keep in control
- Eased QA
- CtQ workflow enabled
- Better quality
- Faster QA
- Lower part cost
- Lower assembly cost
- Lower COPQ
Low Sensitivity
- Same tolerances --> Better performance
- Eased tolerances --> Same performance
- Lower variation on performance parameters
- Enablement of low cost suppliers
- Enablement of cheaper/faster manufacturing processes
- Better quality
- Lower cost
- Faster sourcing
Stress Free Designs
- Material optimization possible
- Less friction in systems
- Less wear
- Increased lifetime
- Less noise
- Eased assembly
- Increased efficiency
- Increased product lifetime
- Improved user experience
- Increased product lifetime
- Increased customer satisfaction
What Are the Challenges and Limitations of Robust Design?
Often the hero is the production worker fixing an issue rather than the designer that prevented it day 1.
Care to making the ideal foundation and gather know-how early in the design process is key for success and easier said than done.
RD8 Software is a helpful tools when the foundation is made - to ensure predictability and robustness of the function. But the software does not dictate if you should design a gear or a four-bar mechanism to achieve the desired movement (as an example) or use a belt or a chain in your application.
What Is the Difference Between Robust Design and Six Sigma?
Six Sigma
People often use Six Sigma as a quality standard when talking about process capabilities and derives from the statistical world.
“The name ‘Six Sigma’ derives from statistical terminology; Sigma (σ) means standard deviation.
For a normal distribution, the probability of falling within a ±6 sigma range around the mean is 0.9999966.
In a production process, the ‘Six Sigma standard’ means that the defect rate of the process will be 3.4 defects per million units.”2
2) KAI YANG, B.E., 2003. Design for Six Sigma: A Roadmap for Product Development. United States of America: McGraw-Hill, p.21
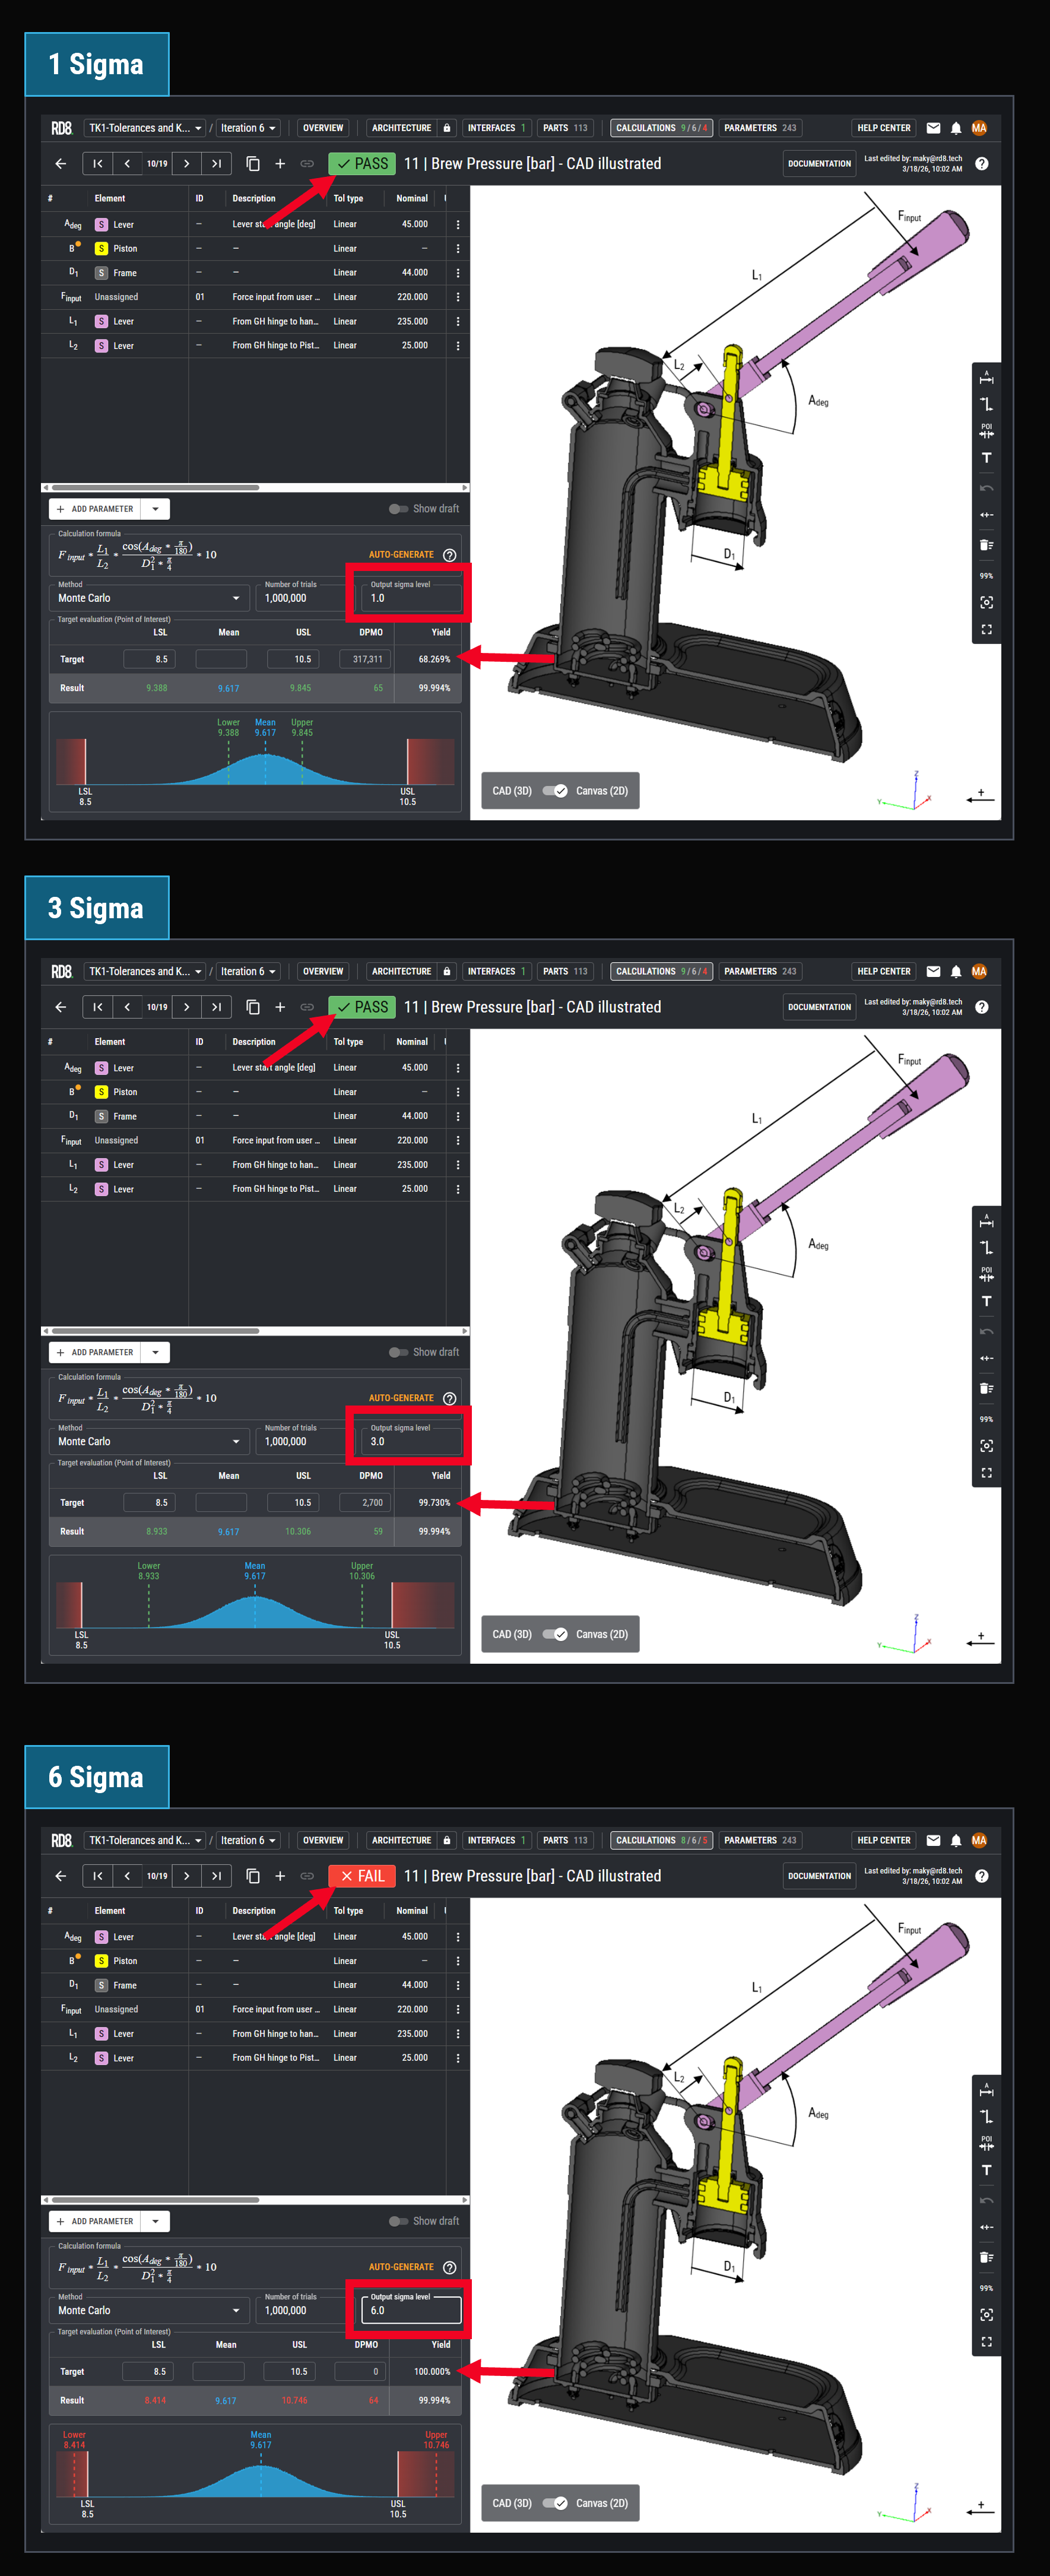
Six Sigma rather describes a quality limit for a design - how many failures that are accepted. In the example to the right 3 different sigma levels is stated as an acceptance level.
- A sigma level of 1 equals a target yield of 68.3%
- A sigma level of 3 equals a target yield of 99.7%
- A sigma level of 6 equals a target yield of 100%
In the coffee brewer example - the current performance of the design is 99,9%. Hence it would pass sigma levels of 1 and 3 but not a 6 sigma requirement.
Robust Design Context
Robust Design methods are about making designs less sensitive and about increasing performance - meaning to make a more narrow spread of the bell curve. Increased robustness in the coffee brewer example would most likely make the function to pass also in a 6 sigma context.
The point about Robust Design is to improve the performance BY DESIGN. Not by tightening tolerances or more strict quality control - but rather by BUILT IN quality. Making a design that no matter the variation - the performance will always be within the given requirements.
Some refer to "Design for Six Sigma" - a different toolbox for lowering variation by design.
How to implement Robust Design in an Organization?
The RD8 Ecosystems support companies to implement Robust Design.
- RD8 Engineering Academy: Upskilling
- RD8 Software: Tools and methods
- RD8 Consulting: Setting up ideal workflows, roles, responsibilities.
- Quality as a system
Efforts should be driven from Top Management - System thinking
Focus on systems rather than parts. All should work together as a system to improve the quality. No silo thinking. - Flow charts
Culture - everyone should know their role and how they play into context - how they contribute to quality. From the engineer, to top management, to the production worker. - Leadership
Showing the way - Datadriven approach
Use guiding metrics as process confirmation and to provide design direction - Common language
Ensure a common pool of know-how. - State the logic
Be ambitious - with the ambition of being better - not only at the nominal stage. Strive for minimum variation.
What Tools Are Used in Robust Design?
- Interface Analysis Software: RD8 Software features an Interface Module
- Kinematic Analysis Software: RD8 Software features a mobility equation solver/checker
- DoE: Design of Experiments - useful if no transfer function can be determined analytically - then DoE can be a method for identifying and determining sensitive parameters
- Skeleton Modelling: PTC Creo offers a unique skeleton model feature which is excellent for designing interfaces rather than parts.
- Tolerance Analysis Software: RD8 Software provides a tolerance analysis module.
- Sketch Software: Enventive Concept is a great tool for sketching 2D concepts while thinking of variation. Together with the ability to design dynamic systems.
- Physical Sketch Tools: physical tools like reMarkable are useful to quickly sketch and share ideas
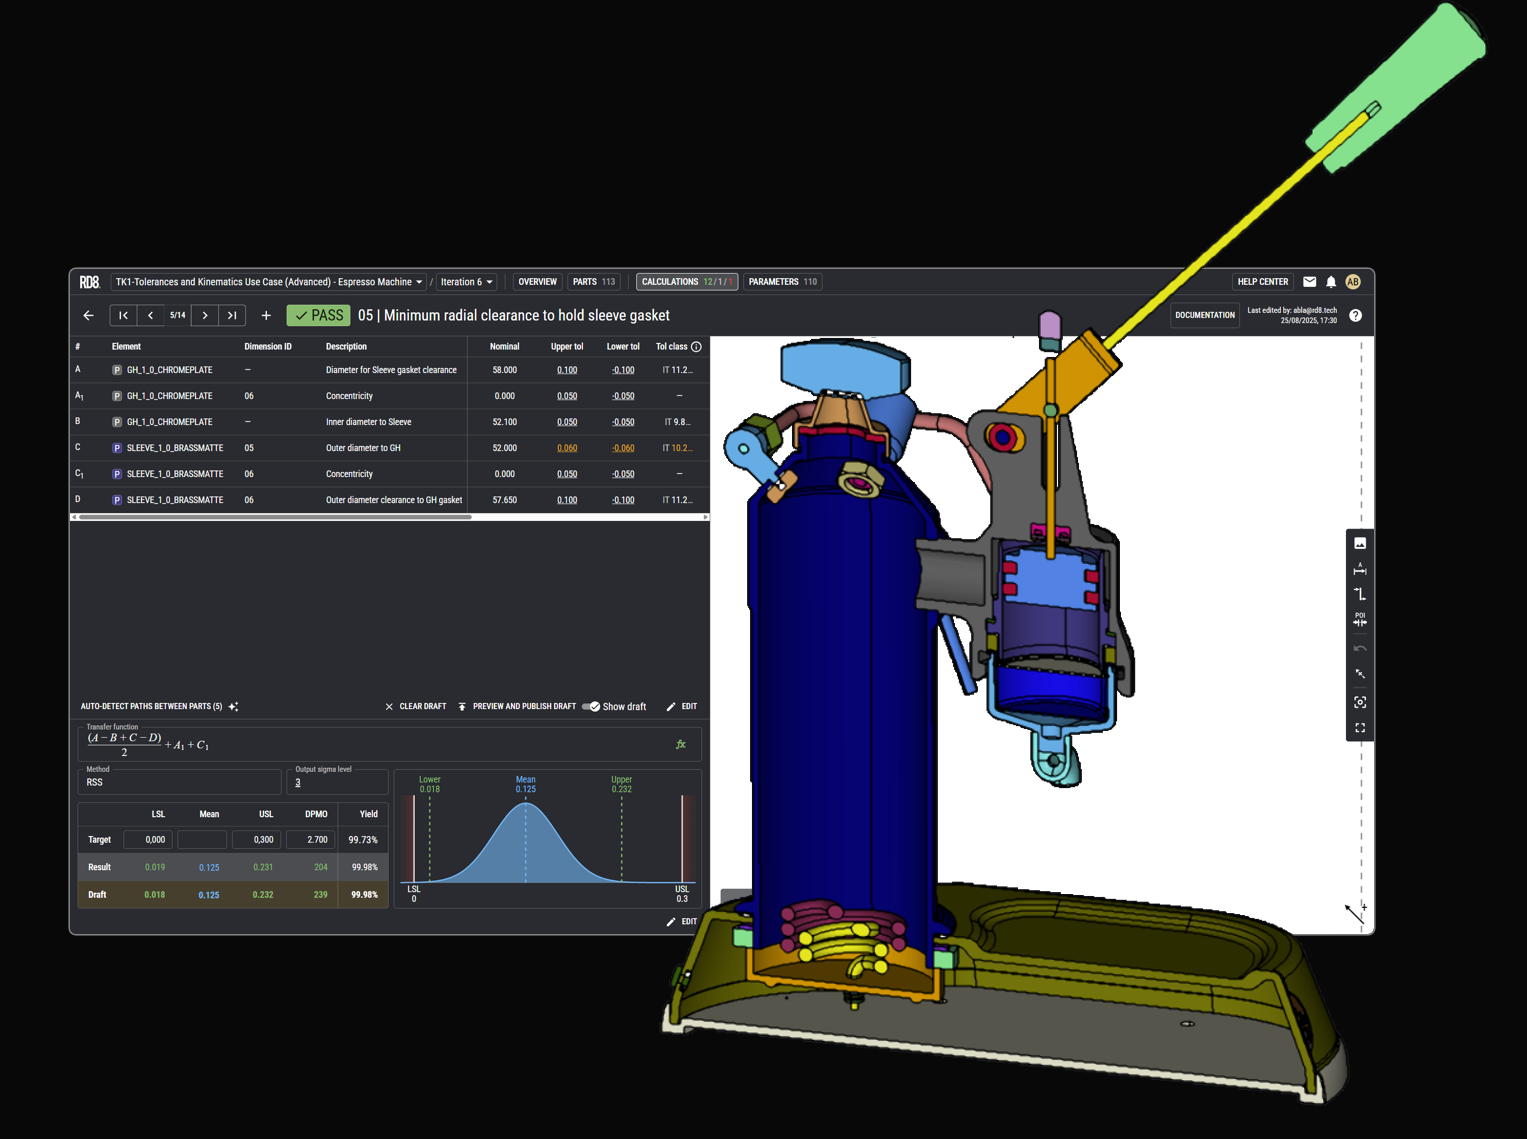
What Is the Role of Tolerance Analysis Software in Robust Design?
- In essence - tolerance software helps you to define what tolerance you should put into your CAD model and then next on to the blueprints.
- Being explicit - what is the objective? Tolerance analysis software helps to make explicit what the different targets are - both in terms of target, limits and sigma levels - but also for pointing out exactly what detail are in focus.
- Stating assumptions - looking up suiting tolerances for dimensions based on their production process.
- Documenting assumptions. Making clear documentation of parameters used and assumptions for tolerances and distributions types.
- Forecasting performance of design.
- Analyzing functions - identifying sensitive parameters that has great influence on the function.
- Identification of tolerance stack. RD8 Tolerance Analysis software helps you to set up tolerance stacks based on a few inputs.
- Geometry optimization. RD8 Tolerance Analysis Software identifies critical points in your 3D CAD model where geometry can be improved to simplify (to eliminate need for GPS/GD&T symbols and or eliminate tolerances).
Master tolerances with RD8 software
Instead of relying on gut feeling or Excel-based stack-ups, RD8 gives your team a modern, visual, and collaborative piece of software to manage variation. Whether you're designing precision mechanisms or high-volume components, we help you brings clarity to complex assemblies - and avoid costly rework, ensure functionality, and speed up development cycles.

Get in touch with our experts
Ready to bring structure and predictability to your tolerance work?
Shoot us a message and we will get back as soon as possible.


By submitting, you accept RD8's Privacy Policy and Terms of Service.