Tolerance stack-up analysis: definition, methods, guide and software
What the standard guide doesn't tell you.
• How to eliminate the need for dimensions and tolerances
• How to lower variation (improving quality) without tightening tolerances
• How to make sure your tolerance stack is valid
Learn how to master tolerance analysis. Not only for the stake of analysis - but with the purpose of making better designs that are simple and predictable.

Explore the Steps to Become an Expert in Tolerance Stack-Up
Tolerance Stack Up Guide
Description
Learn More
Why is tolerance stack-up important?
Why is tolerance stack-up important?
Tolerance analysis is essential for ensuring that parts fit together and function as intended.
It impacts:
• Product functionality - ensuring that the product always work, in all conditions, also when an assembly consists of parts all pushed to their limits of their tolerances
• Cost efficiency - Reduce need for tight tolerances, inspection, reduce scrap, expensive redesigns
• Reliability and quality - Deliver products that meet performance standards consistently
Not performing a proper tolerance stack-up analysis can lead to unplesant surprices, costly to fix downstream. By understanding and applying tolerance stack-up analysis, you can optimize design, improve manufacturability and maintain quality control throughout the product lifecycle.
This task is often postponed late into the design process - then revealing issues that can only be solved by making more precise parts (which is costly, more time consuming, harder to source or keep in control).
What is tolerance analysis?
What Is Tolerance Analysis?
The primary purpose of tolerance stack-up analysis is to determine whether a mechanical assembly will meet its functional and dimensional design requirements when real-world manufacturing variations is taken into account.
Tolerance Analysis plays a critical role in both mechanical design and manufacturing by clarifying how GD&T/GPS, part tolerances, and process capability combine to influence variation and then the overall product performance
In short: it predicts if parts will fit and function correctly before anything is produced
The core principle of tolerance analysis is about simulating product functions that are relying on mechanical properties - mainly the shape and size of the mechanical parts - which are typically described and specified by dimensions and tolerances. The are different methods for specifying dimensions and tolerances: 'regular' linear tolerances, Geometric Dimensioning and Tolerancing (GD&T) or ISO Geometrical Product Specifications (GPS). GD&T is often used in America and GPS is more commonly used in Europe. The fundamental principle is circulating about a calculation. The a calculation is used to describe a product function e.g. a seal between two parts, the mating between a series of parts in an assembly, the accuracy of a robot arm, the installment of the interior parts in a car to ensure no rattle. For each element in the calculation thresholds - tolerances - are applied. Then the calculation can be calculated by different statistical methods and different types of tolerances can be applied (symmetric, asymmetric, normal distributions, trapez distributions, ...) which then predicts the performance of a product function under different circumstances.
RD8 mainly makes use of four different statistical methods for tolerance stack-up analysis
- Worst-case analyis: assumes all features are their extreme limits
- Root Sum Square (RSS): simplified statistical approach
- Statistical: RSS with process capability parameters
- Monte Carlo Simulation: simulates large sets of random variations for realistic predictions
What are the types and methods for tolerance stack up
What are the types and methods for tolerance stack-up?
The methods for tolerance stack-up analysis are explained below.
All four are standard approaches in tolerance analysis, each offering a different balance between simplicity, accuracy, and how realistic the predicted assembly variation.
1. Worst Case (WC)
Maximum safety margin
Adds all tolerances, in their most extreme directions to obtain the worst possible configuration:
- Assumes every part is at its max./min. limit simultaneously all the time.
- Typically used for fits and assemblies with less than 2-3 fitting parts.
- Best for safety-critical designs where failure is not an option (most conservative estimate).
2. Root Sum Square (RSS)
Smart stacking with local linearisation
- Models each parameter with a normal distribution and combines tolerances statistically by the root sum square formula.
- Typically used for assemblies with more than 2 parts.
- Typically used intial estimates - when not all variables are known.
- Typically a bit too optimistic.
3. Statistical
RSS with process capability parameters
- Takes process capability parameters into account to produce worst case configurations of mean and variance shifts. Uses these configurations in an RSS calculation as described above.
- Best for high-volume production where process variation is well understood.
- Typically used for more precise estimates than a simple RSS if Monte Carlo functionality is not available (in an excel sheet or similar).
4. Monte Carlo
Real-world simulation
- Runs thousands, even millions, of random simulations of the function expression, while modelling each parameter with a probability distribution and sigma level of your choice.
- Best for complex assemblies with many interacting variations and non-linearities.
- Best for assemblies with more than 2 components.
- Best for most realistic estimates.
How to calculate tolerance stack up
How to calculate tolerance stack-up
1. Define functional requirement, focus area and scope for analysis [use the RD8 target setting feature]
• What’s the goal? Alignment? Assembly clearance control?
• Be super specific – only focus at one topic at the time (for each stack)
2. Map and illustrate the Stack Path [use the RD8 stack-up canvas]
• Trace the path from start to end – feature by feature
• Sketch it with parameters, direction and point of interest for clarity
3. Identify input parameters with nominal value, tolerance and direction [use the built-in tolerance look-up functions in RD8]
• Use functional dimensions related to interfaces and 2D drawing
• Identify and add all parameters to the calculation
• Assume tolerances, process capabilites and distributions types for each parameter
• Optional: add parameter info, class and impact
4. Select calculation method [choose your preferred calculation method in RD8]
• Select either Worst Case, Root Sum Square, Statistical or Monte Carlo depending on development stage (how much information you got), number of parts /parameters in the stack.
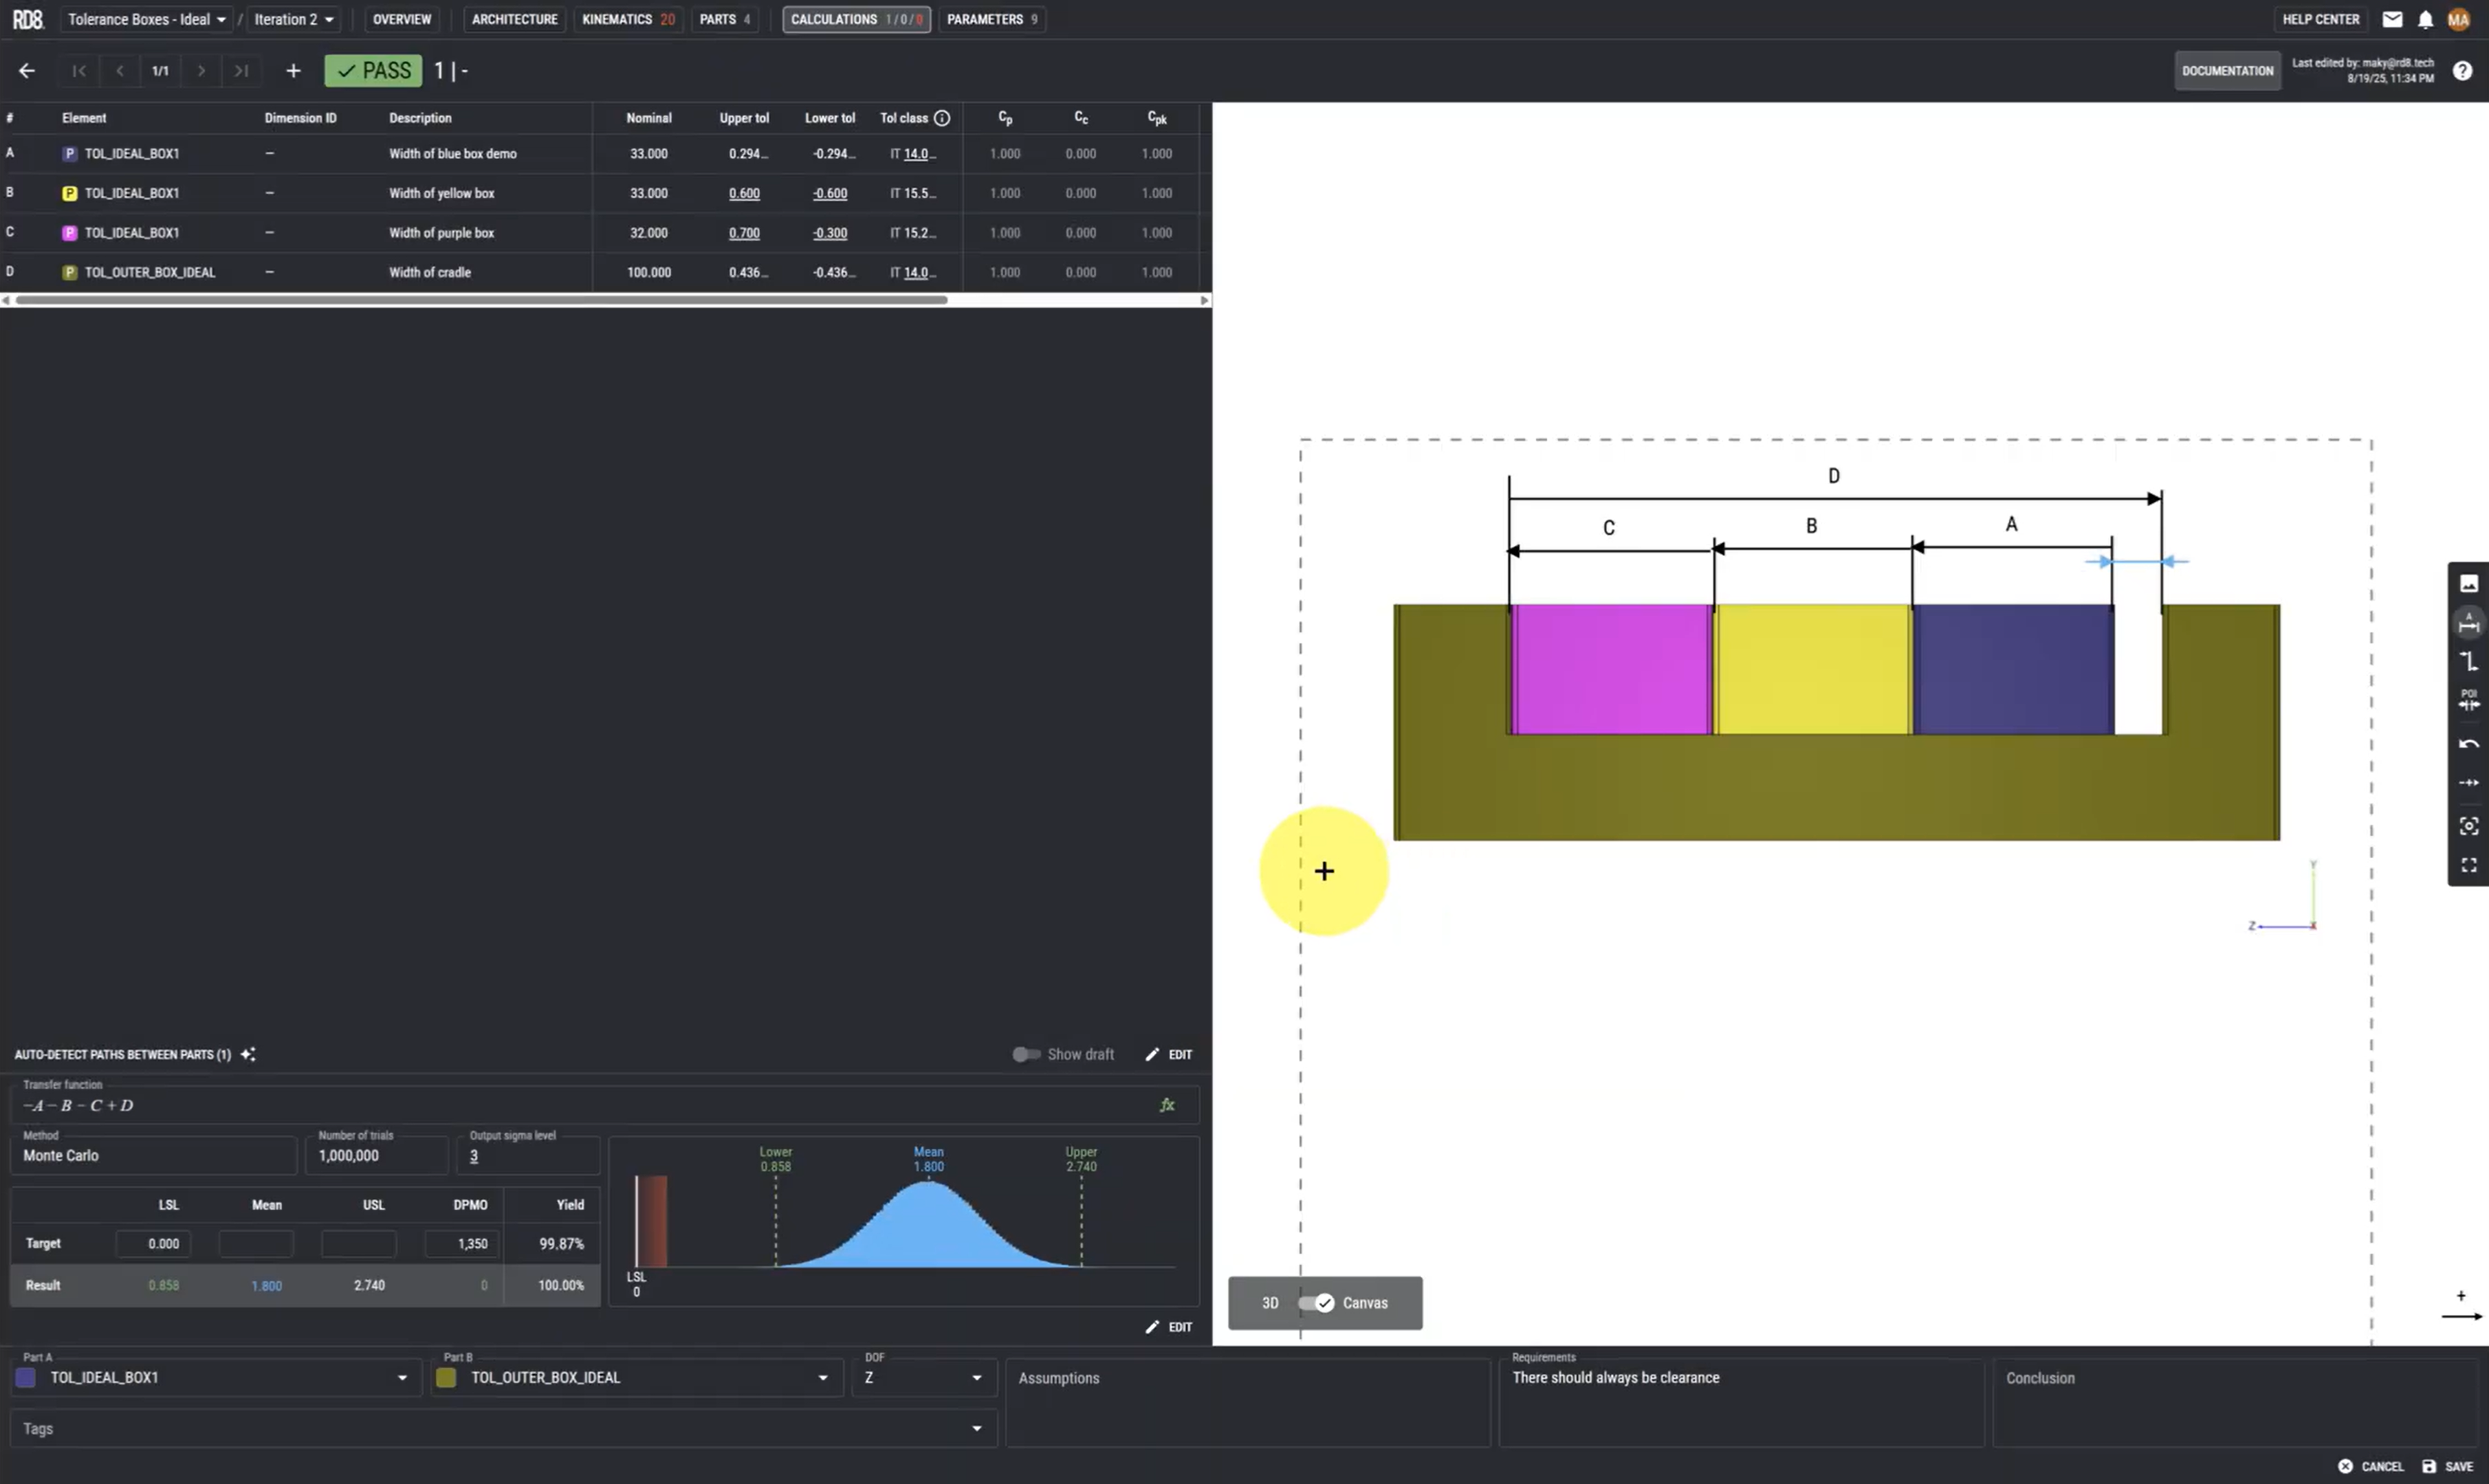
5. Calculate result [can be done automatic for linear stacks in RD8]
• Set up the functional expression of the stack or calculation.
6. Evaluate result and compare to functional limits [a histrogram with limits is plotted in RD8 ]
• Does your total variation fit the acceptable range?
• Are yield or DPMO (Defects Per Million Opportunities) within the expected limits?
• If not → tweak tolerances, optimize/redesign or loop back
Each step builds on the previous - but sometimes there can be a reverse of the order - e.g. sometime a rough tolerance stack-up is done to get a sense of idea of what the specification should be.
Tools and Software for tolerance stack up analysis
Tools and software for tolerance stack-up analysis
RD8ExcelCETOL 6σ3DCS
- Full overview of multiples stacks and relations.
- Work with 1D-, 2D-, 3D-, unlinear-calculations (can do Worst Case, RSS, Statistical and fast Monte Carlo Simulations).
- Automatic tolerance stack-up detection and setup.
- Unique optimization feature - automatic identification and highlight of overconstraints. Checks DOFs in 3D.
Enventive Concept
- Hanheld overview of multiples calculations and relations.
- Typically setup to work 1D- and in some cases 2D-calculations (can do often do Worst Case and RSS simulations).
- Manual tolerance stack-up detection and setup (typically switch between apps: CAD, Power Point, Excel).
- No optimization features.
Matlab
- Manual handling of stacks and relations.
- Work with 1D-, 2D-, 3D-calculations (good for complex 3D assemblies - can do Worst Case, RSS, and Monte Carlo Simulations).
- Needs expertise to set up.
- Risk of overseeing faults in assumptions for setting up the stack (as there might be overconstraints in the design that makes the stack unvalid or unpredictable).
- Focused on early stage concept development - excellent for complex dynamic mechanisms.
- Primarily 2D-calculations in conjunction with forces (can do Worst Case, RSS, fast Monte Carlo Simulations).
- Needs expertise to set up.
- Checks constraints and DOFs in 2D.
- Manual setup for speciliazed cases with possibilities for custom plots.
- Coded for special purposes.
- Needs expertice to set up and use.
- Risk of coding faults and wrong assumptions.
Common mistakes in tolerance stack up - and how to avoid them
Common mistakes in tolerance stack-up - and how to avoid them
Avoiding common tolerance analysis mistakes improves product reliability and reduces costly rework.
Wrong tolerance path
Leads to - incorrect results and unpredicatable product behavior.
Avoid it - by identifying the correct tolerance path. The RD8 path finder feature automatically detects and set up the path for the user.
Conflicting tolerance path
Leads to - unpredictiable results (only right in some samples).
Avoid it - by checking for design clarity and overconstraints in the design prior to set up of the stack. The RD8 path finder feature automatically checks for possible paths to ensure that tolerance stack is unambigious.
Too tight and too many tolerances:
Leads to - high part cost, difficult sourcing and quality control.
Avoid it - simplify the tolerance stack by design to loosen tolerances. The RD8 Optimization feature helps with just that.
Wrong tolerance allocation:
Leads to - unnessary high part cost or assembly malfunction.
Avoid it - know you process capabilities and assign tolerances accordingly. The RD8 tolerance allocation function that is based on "ISO 286" and automatically looks up the suited tolerance based on the given process capability (IT grade).
Tolerances that is out of date
Leads to - assembly and functional product errors.
Avoid it - by keeping the 3D model, tolerance stack-up calcualtions and 2D drawing documentation in sync. RD8's parameter list gives an up-to-date overview of dimensions and tolerances that should go onto the 2D drawing.
Last minute changes
Leads to - functional failures if details are overlooked.
Avoid it - check all calculations after a change. The RD8 system is based on a global parameter list and the user can simulate effect of changes to all calculations before a change is rolled out.
Poor specifications
Leads to - that product design does not meet the user needs.
Avoid it - by (systematically) breaking down the user needs to a functinoal requirement. See the RD8 Critical-to-Quality approach.
Stacks are not done
Leads to - random 2D drawings without any reasoning for specifications resulting in failing product functions.
Avoid it - by setting up calculations/stacks for all critical functions. This is often skipped if it too complex to break down the function to a calculation or if it is too timeconsuming to set up an analysis. The RD8 system is made for quick analysis and easy set up.
Too late stack-up calculations
Leads to - need for unesssary strict toelrances (and the downstream effects hereof).
Avoid it - by making pre-CAD estimates to layout the product functions and tolerances stacks to define the most robust concept design possible (before it is too late to change anything). The RD8 system can be used up-front -before a CAD model is present - to estimate and layout optimal stacks.
Using too many GD&T modifiers
Leads to - ultra high part cost.
Avoid it - by being in control of the design. The RD8 Optimization feature augments to break down complex 3D-problems to simple 1D- or 2D-stacks.
Important dimensions are not marked on the 2D drawings
Leads to - unpredictable product functionality.
Avoid it - by taking all the elements from the tolerance stack analysis and mark them on the 2D drawings as inspection measures. Depending on criticality of the inspection measures the IPC (In Process Control) strategy can be defined.
Best practices for managing tolerance stack up
Best Practises for managing tolerance stack-ups
Critical-to-Quality Approach
Use the Critical-to-Quality approach to ensure a tracability and breakdown from user needs and all the way down to the tolerances on the drawings.
Calculate before Design
Understand the function you design before you sketch. Getting a fundamental understanding is crusional for laying out and optimizing the stack-up before tools are ordered.
"Less Is More"-mindset
Create a culture where there is pride in doing design with loose tolerances (and all the benefits of it).
Tolerance Calcualtion as Team Practice
Coordinate efforts in a design team to meet product specifications. Aligning and mapping relations of part, functions, dimensions and tolerances to make sure all fits when the products meets start of production. The RD8 tool gives an instant overview of all product functions.
Fast Iterations
Not being affraid of making changes. This 'feeling' is often becasure the design is not in control. With the RD8 system and tolerance stacks set up - the designer can quickly iterate and test alternative ideas and design. The RD8 iteration feature makes it easy to keep design history and to update design.
Objective Design Reviews
The ability to give precise feedback, quickly; is a must when talking tolerance stack-up optimization. In RD8 all assumptions are clearly stated - results are highlighted - and the documentation canvas can be used to mark improvements, comments and ideas.
Guiding Design Metrics
Having a clear target and a way to measure quality before SOP (Start Of Production) is paramount for managing design teams with high ambitions. The RD8 system has unique objective design metrics that tracks:
1. The quality of the CAD foundation (the Kinematic Index)
2. The number of passing functions (that meets specifications)
3. Indicative product metrics (number of parts, number of mechanical interfaces, number of parameters, parameters/part, lowest tolerance grade, highest tolerance grade)
Feedback Loops from Production and Assembly
Ensuring process capabilities are know by the mechanical engineer and that production data (yield and quality) is returned in a feedback loop.
Tolerance Stack-Up: How to Set Up a Tolerance Analysis
Step 1
The Basics: Tolerance Stack Up Example
Step 1 - the basic techniques for setting up a tolerance stack.
In this guide we give a very basic Tolerance Stack up Example. We cover how RD8's Tolerance stack up analysis software works and how it will help you calculate your own tolerance stacks easily.
This includes how to define dimensions, assign tolerances, and assess their combined impact on assembly variation while gaining insight into best practices for Robust Design.
You will also see how to use different methods like Worst-Case Analysis, RSS, and Monte Carlo SImulation methods.
Lastly the guide covers how to define your requirements and make sure that your tolerance stack fulfils the requirement without failing.
Step 2
How To Handle Clearances
Clearances can be tricky - especially when dealing with tolerance stacks - and can significantly impact your design's performance if not managed correctly. This guide will show you a systematic approach to set up a tolerance stacks with clearance in the assembly, using a simple example to make the process clear.
You will learn how to define parameters, add dimensions and tolerances, and automatically find the transfer function for calculations.
The guide also covers best practices for handling clearances, such as making calculations with all parts at their extreme positions, and using Robust Design principles to eliminate the impact.
Step 3
Finding Your Tolerance Stack Path
Sometimes tolerance stack paths are easy to identify, but when you have more complex assemblies, it can be difficult to find the path. And in some cases perhaps impossible as there can be conflicting tolerance paths. This guide explains exactly why conflicting tolerance stacking paths can risk making you design unstable and problematic.
We will cover exactly how to find your tolerance stack path with a few examples of tolerance stacking using RD8's tolerance Path Finder, which can identify risk of conflicting paths much easier than the human eye.
You will see how conflicting paths are causing over-constraints - but also how these can be managed by Robust Design principles.

Step 4
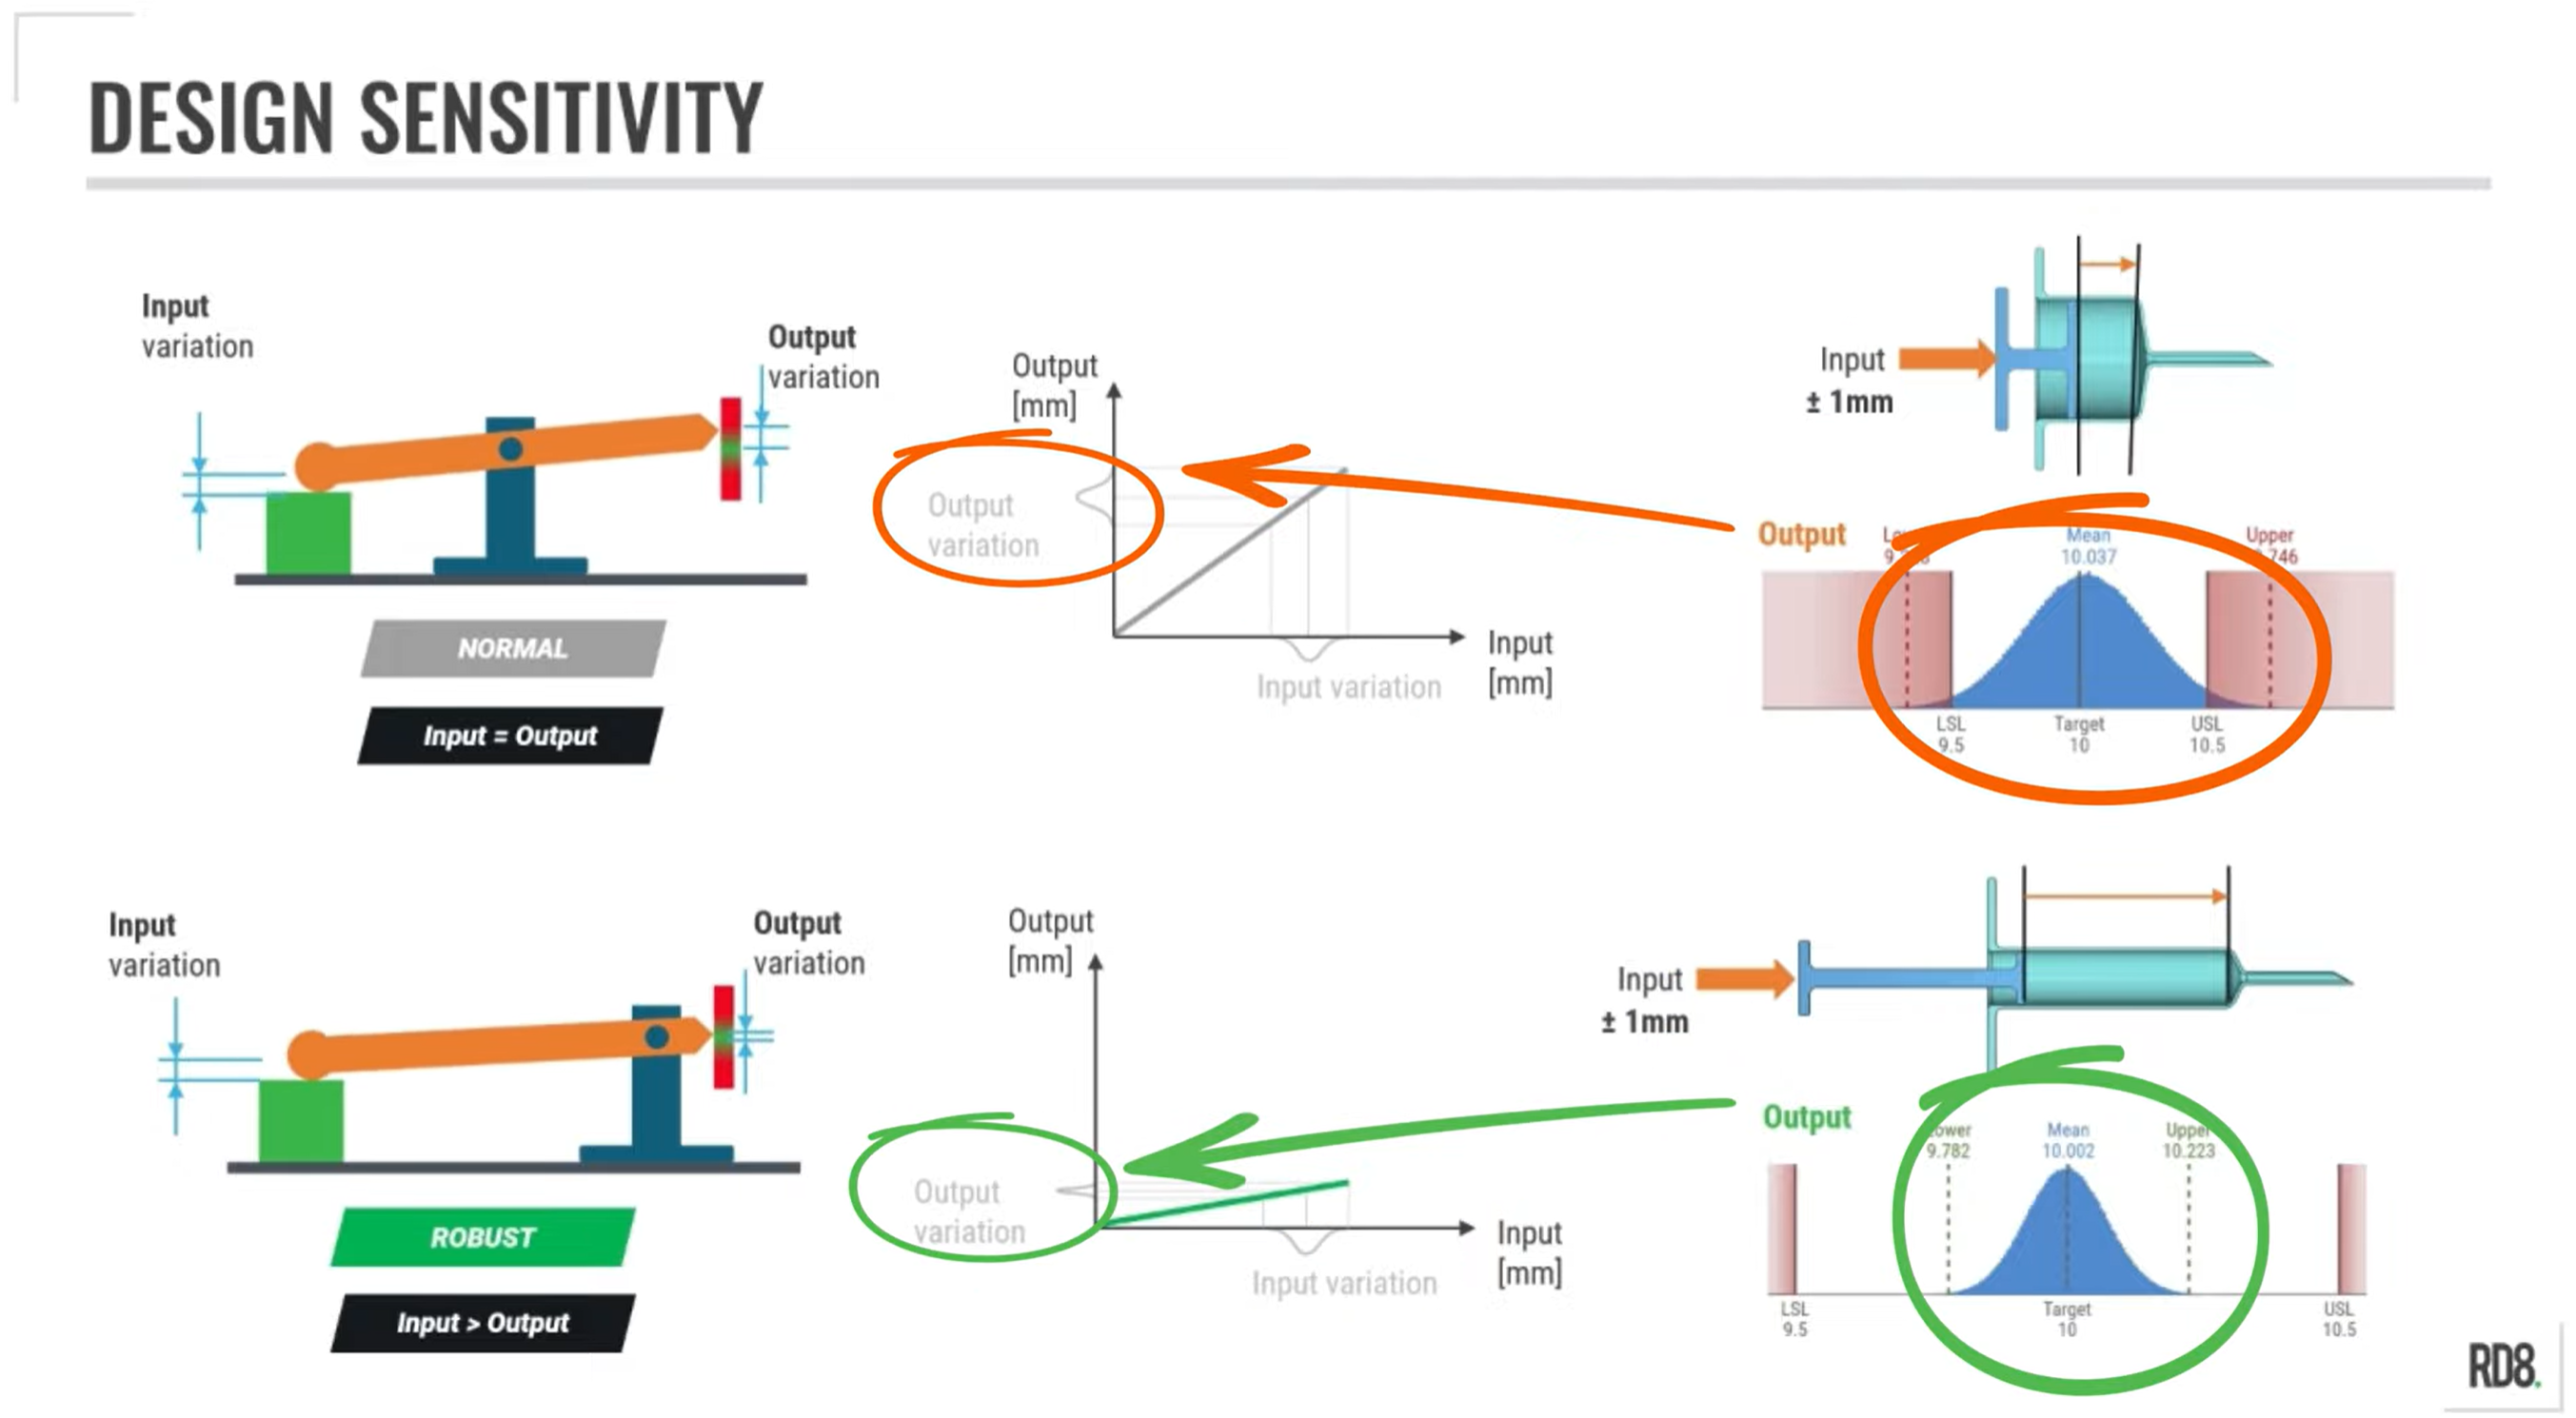
Parameter Sensitivity and Optimization
In this guide we explore how to manage parameter sensitivity and parameter optimization. With the objective of avoiding large variations in the final product/function due to a high sensitivity to input variations.
We go through the importance between sensitive- and Robust Design, and link it all to the tolerance stack in the design.
You will also be introduced to the best practices from Robust Design and Tolerance Stack-Up to reduce sensitivity in your designs, including keeping dimensions small and simplifying and reducing the number of parameters in a tolerance stack.
Step 5
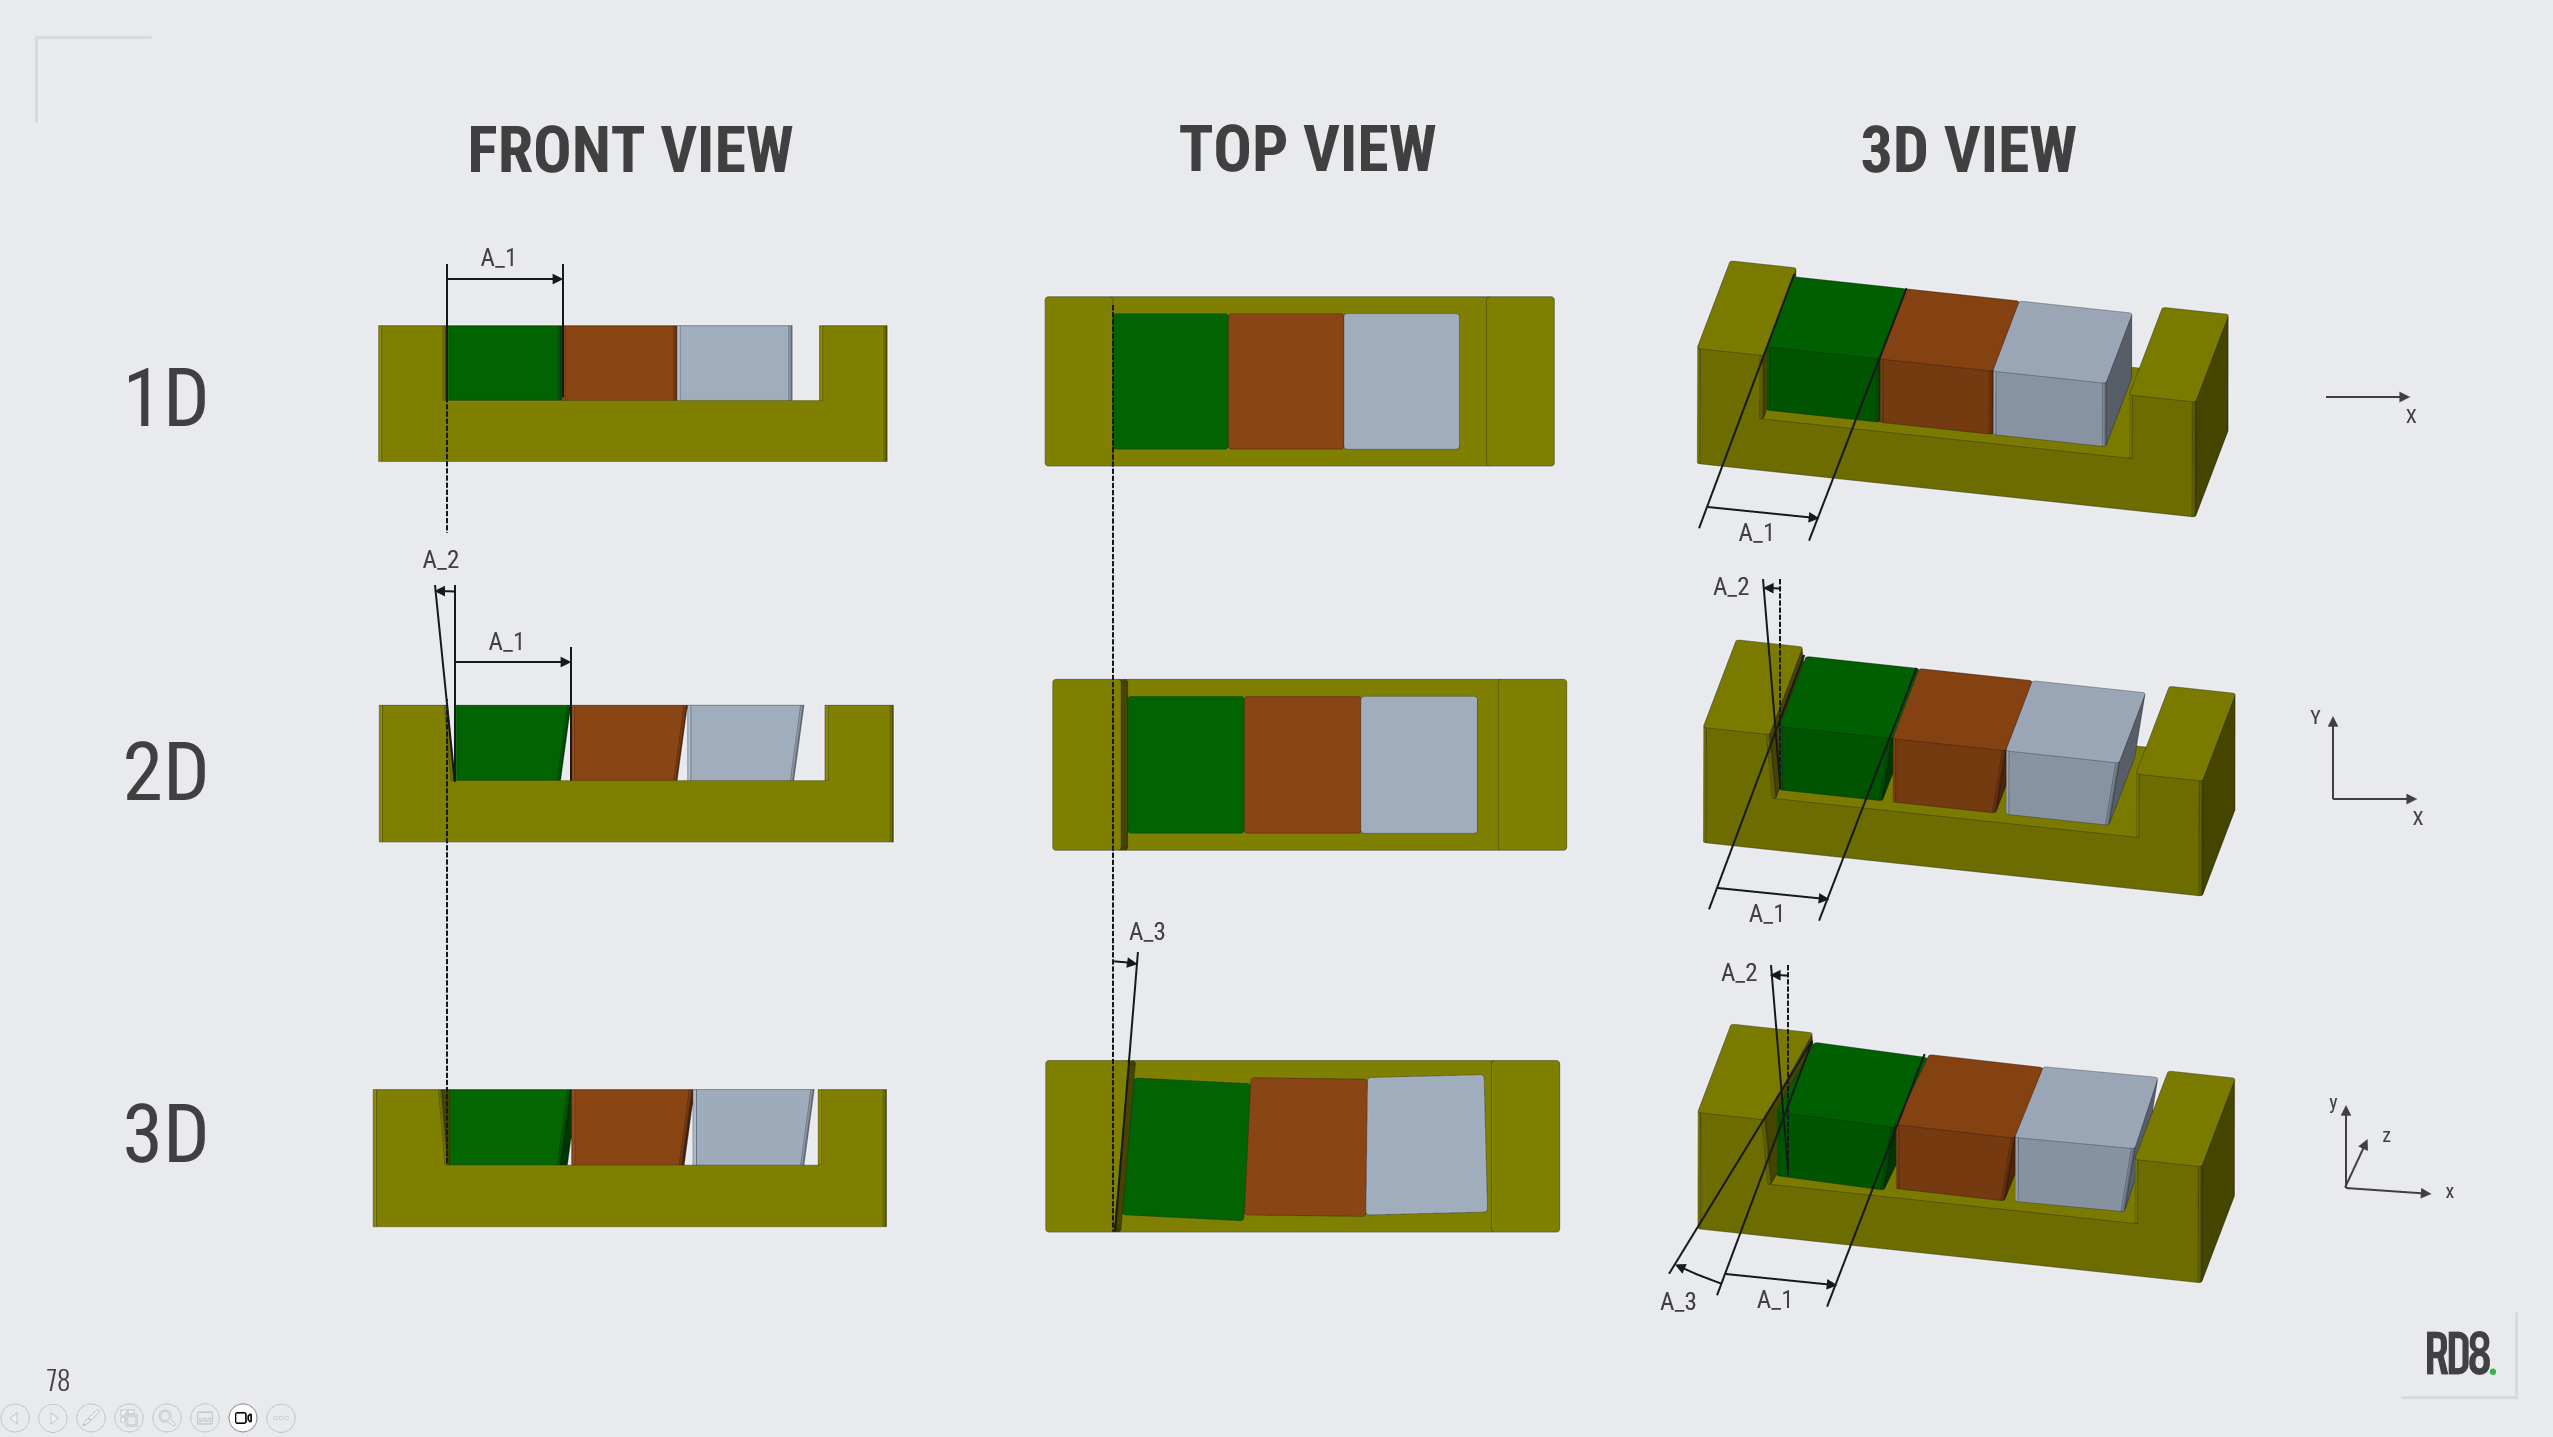
Two-Dimensional Stacks (...and the difference between 1D-, 2D-, and 3D-stacks)
The different notions for 1D-, 2D-, and 3D-tolerances-stacks are explained in this step.
The key in this step is to simplify your design in order to minimize information and gain control of the design (so it it is simple to predict).
Make Tolerancing Easy - Talk to an Expert to get to know the RD8 Software

By submitting, you accept RD8's Privacy Policy and Terms of Service.