Design to scale up manufacturing volume in drug delivery devices
Demand for reliable, high performance designs is increasing everywhere. Scaling a design can be painful if your sensitivity also scales. A larger volume will reveal more of your rare failure modes and dimensional pairings - the long tail of your statistical performance.
Systematically find and eliminate failure modes and sensitivity. Avoid late delays and costly surprises in manufacturing.
Increase predictability - eliminate failure modes
Complex functionality, especially in compact designs, can produced unwanted and unseen failure modes, difficult to spot in development and small-scale testing. When designs suffer from low predictability, load paths, tolerance chains, friction contributions and other critical-to-function aspects can abruptly change.
Root cause analysis is retrospective and often misleading.
An operational approach is to systematically increase predictability using architecture and interface design. UsingRobust Design principles and kinematics, predictability improves with failure modes and parameter specification eliminated.
This translates to fewer and more controllable design risks.
Reduce variation sensitivity - control scaling risk
Scaling an existing design and manufacturing system is a demanding challenge. Increasing volume and sources of variation pushes pushes performance towards functional limits.
Managing variation and minimising sensitivity, so that your design can absorb the tolerances you can’t get rid of is essential to control risk when scaling.
RD8 works with your tolerance management system or offer a proven framework and toolkit to help you stay in control, from early stage to scale-up.
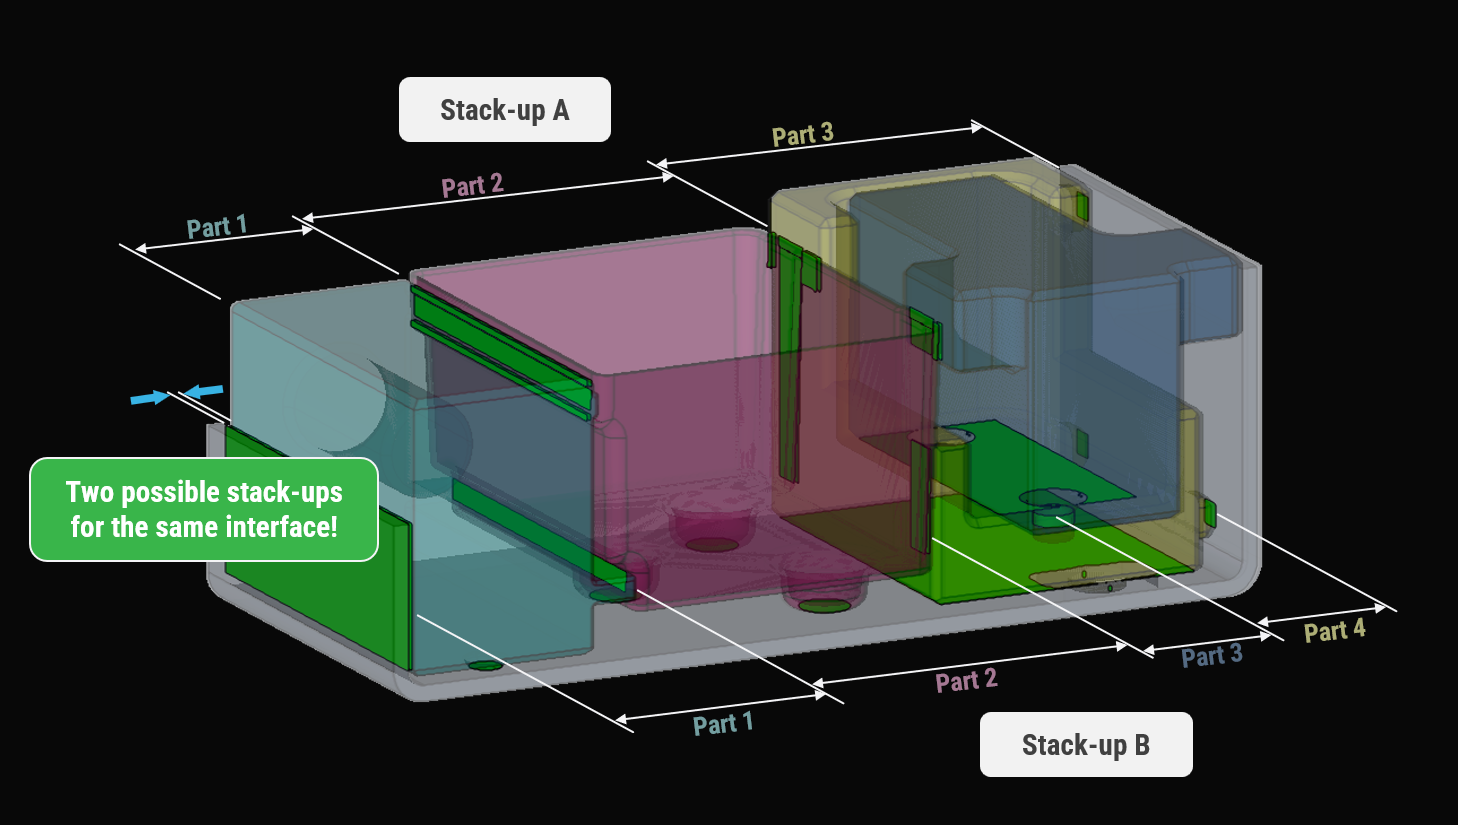
Many device teams benefit from actively identifying and reducing influence of un-wanted or non- value adding part geometry as a very operational approach to reduce scaling risk.
Inherent performance bydesign - DfM for high volume injection moulding
Optimising functionality and DfM needs to go hand in hand. Done in isolation it becomes a tug-of-war resulting in low-value iterations or costly tooling runs. Development teams often struggle with synchronising both and avoiding long response cycles from manufacturing development, production and metrology.
Using Robust Design principles a design can systematically preserve functional surfaces and integrity while optimising for high-volume production. Trade-offs can be monitored and documented to control mitigation efforts from the start.The same goes for tolerance optimisation – ultimately driving towards Inherent performance by design
Discover how RD8 can ease your Tolerace Analysis and Variation Management
Frequenly asked Questions
In tolerance analysis, there are three main calculation methods used by engineers to predict how part variations will affect assembly:
Worst Case Tolerance Analysis – This method assumes every part dimension is at its maximum or minimum limit at the same time. It guarantees the assembly will work under the most extreme conditions, but it’s very conservative and often drives unnecessarily tight manufacturing tolerances, leading to higher costs.
RSS Tolerance Analysis (Root Sum Square) – A statistical tolerance analysis approach that assumes dimensional variations follow a normal distribution. By combining these variations using the tolerance stack-up formula (root sum square), it predicts a more realistic variation range, offering a good balance between quality and cost.
Monte Carlo Tolerance Analysis – A simulation-based method that uses thousands of random iterations to model real-world variation. This approach is ideal for complex 3D tolerance stack-up analysis and non-linear tolerance chains, delivering highly accurate predictions of assembly performance.
Summary: Worst Case = safest but costly, RSS = balanced statistical approach, Monte Carlo = most realistic simulation for modern tolerance engineering.
No - RD8 Tolerance Analysis is CAD-agnostic. We work with the industry-standard STEP file format (.stp), allowing us to handle models from any major CAD system, including Creo, SolidWorks, AutoDesk, CATIA, NX, and others.
All CAD data is imported manually, including geometry from STEP files as well as additional manufacturing data such as parameter lists, tolerance specifications, production methods, and MBD (Model-Based Definition) if available in the file. This approach ensures RD8 can work with whatever design and production information you can provide, regardless of your CAD or PLM system.
In short: Any CAD system works - as long as you can provide a STEP file, RD8 can perform the tolerance analysis.
A failed tolerance stack-up can have severe consequences in both production and product performance:
Production stops – One of the worst calls a design engineer can get is from the production manager saying: “The assembly line is blocked – your parts don’t fit!” This can halt production instantly, sometimes costing €10,000–€100,000 per hour in lost output.
High scrap and rework rates – Even a 5% yield loss on a high-volume line can mean thousands of rejected parts per week.
Delayed market launch – Fixing tolerance issues late can add weeks or months to schedules.
Defects Made it Past Outgoing – Assemblies that pass inspection but later fail in the field create warranty costs, brand damage, and customer dissatisfaction.
Functional failures – Parts may not work correctly from day one, or they may fail after months of use when exposed to wear, gravity, water ingress, temperature cycles, environmental loads, chemicals, or unexpected forces.
Hidden performance degradation – Even if the product doesn’t outright fail, poor tolerance control can cause increased noise, vibration, leaks, or reduced service life.
In short: A broken tolerance stack-up doesn’t just hurt quality – it can stop production, drain profit, and damage reputation. That’s why robust tolerance analysis is critical before release.
While Excel is readily available and familiar, it has serious limitations when used for tolerance stack-up analysis:
Single-user bottleneck – Only one engineer can safely work on a spreadsheet at a time, making collaboration slow when multiple engineers are working on the same assembly.
Parameter sync problems – Many parameters and parts are reused across multiple tolerance stack-ups. In Excel, a change in one location can silently break another stack-up, and it’s nearly impossible to keep everything in sync.
No change tracking – In Excel, changes happen instantly without traceability. One edit can unknowingly disrupt your colleague’s calculations. RD8 includes parameter change impact review so you can see exactly how changes affect others before they are applied.
Multiple tools needed – With Excel, you also need PowerPoint for sketches, CAD software to view models, and complex macros for calculations. RD8 combines spreadsheets, sketching, and CAD viewing in one tool, streamlining your workflow.
Limited analysis capabilities – Excel struggles with Monte Carlo tolerance analysis, non-linear stack-ups, and large assemblies without significant manual programming.
High maintenance – Complex Excel tolerance sheets often require a dedicated “Excel wizard” to maintain formulas and macros - and to fix them when they inevitably break.
In short: Excel can work for small, simple tolerance calculations, but for real-world, collaborative engineering work, RD8 offers a one-stop solution with built-in spreadsheets, sketching, CAD viewing, and advanced analysis methods — all without the sync and collaboration headaches.
Ideally, tolerance definition should be a collaborative process between R&D (design engineering) and Manufacturing.
R&D’s role – Design engineers understand the product’s functional requirements, safety factors, and performance expectations. They can determine the critical features and relationships that must be maintained for the product to work as intended.
Manufacturing’s role – Production teams know the real-world capabilities and limitations of machines, tooling, materials, and inspection processes. They can advise on achievable tolerances, cost implications, and process stability.
If R&D sets tolerances in isolation, they may unknowingly specify values that are unnecessarily tight, difficult to achieve, or not measurable with existing equipment - leading to higher costs or production delays. Conversely, if Manufacturing sets tolerances without understanding the functional intent, critical dimensions may be loosened too much, risking assembly failures or performance degradation.
In short: R&D defines the why (function and fit), Manufacturing defines the how (feasibility and cost), and together they define the what (final tolerances that balance function, manufacturability, and cost).
Tolerances are not just a technical detail - they are a cost, quality, and risk control tool.
Without clear tolerances, every dimension is left to interpretation, which can cause:
Uncontrolled variation – Parts may fit in some assemblies but not in others, leading to inconsistent product quality.
High scrap and rework – Mismatched parts often require costly re-machining, sorting, or replacement.
Supplier disputes – Without tolerances, there is no objective reference for whether a part is “in spec” or not.
From a cost perspective, tolerances directly influence manufacturing methods, tooling requirements, inspection effort, and yield rates:
Tighter tolerances = higher production cost due to slower machining, precision tooling, and more inspection steps.
Looser tolerances = lower cost but higher risk of functional or assembly failures.
The goal is not to make every tolerance as tight as possible, but to define each one just tight enough to ensure function, safety, and quality — without over-engineering and inflating cost.
In short: Well-defined tolerances are the blueprint for consistent quality, predictable cost, and smooth supplier relationships. Without them, you gamble with performance, timelines, and budget.
Drug Delivery Themes
Get a Demo

By submitting, you accept RD8's Privacy Policy and Terms of Service.